
Bellingcat est un groupe international indépendant de chercheurs, d’enquêteurs et de journalistes citoyens utilisant à la fois enquêtes open source et réseaux sociaux
▷ BELLINGCAT FRANÇAIS
30.06.2026 à 10:25
Burning Forests: Tools for Tracking and Reporting Wildfire Damage
Galen Reich
If you’ve seen reports of a wildfire in your region and you’re looking for open source data, NASA’s fire-tracking tool is often the first place to start. It provides a heat signature and an approximate location. But detection is only the first step in understanding what’s happened. In this guide, we explore ways to analyse […]
The post Burning Forests: Tools for Tracking and Reporting Wildfire Damage appeared first on bellingcat.
Texte intégral (5851 mots)
If you’ve seen reports of a wildfire in your region and you’re looking for open source data, NASA’s fire-tracking tool is often the first place to start. It provides a heat signature and an approximate location. But detection is only the first step in understanding what’s happened. In this guide, we explore ways to analyse and report on the scale and severity of wildfires, including those in protected areas where ecosystems are often most fragile. We also examine how often fires recur in the same region over multiple seasons, helping to identify patterns in fire activity as climate change reshapes fire risk around the world.
Satellite imagery from Copernicus Browser will be used to visualise the spread of the fire, and vegetation health indices to assess burn severity. The datasets will then be combined in QGIS for more in-depth analysis. At each stage, suggestions will be offered for turning the data into clear, reportable findings.
Throughout this guide, a single case study will be used: Sicily’s Zingaro Nature Reserve. In 2025, wildfires swept across the region, destroying forests, grasslands and croplands. Located on the Capo San Vito peninsula, the reserve was so severely affected that sections remain closed today.
Visualising Scorched Earth
When investigating a wildfire, it’s important to narrow down when it occurred and where it spread. The Landsat and Sentinel-2 missions are well-suited to this task, providing regular free imagery of most of the Earth’s landmass.
Below are two sets of Sentinel-2 imagery showing conditions shortly before and after a fire on July 25, 2025, near Capo San Vito, Sicily. The top two images are true-colour, similar to what would be seen from an aeroplane window. The image on the top right shows an area of scorched earth on the eastern side of the peninsula, but the exact extent of the fire is difficult to determine because the colour of the ground has changed only slightly.

Related articles by Bellingcat
Seeing More With Satellite Imagery Using Band Combinations, Ratios and Indices
The bottom two images are false-colour and highlight the difference between healthy vegetation and burned areas. Such imagery is possible because Sentinel-2 captures bands of light outside the visible range, a technique known as multispectral imaging. In these images, the near-infrared (NIR) band is coloured green, and the shortwave infrared (SWIR) band is coloured red. Healthy vegetation mainly reflects NIR light, so it appears green, while burned areas mainly reflect SWIR light, so they appear red.
These images were created with Copernicus Browser, a free browser-based tool from the European Space Agency for accessing and working with Sentinel imagery. It allows users to browse the Sentinel-2 catalogue by date and visualise different band combinations. You don’t need an account to use the browser, but signing in enables additional features.
If you’d like to try Copernicus Browser without further explanation, you can go straight to the false-colour post-fire image here.
To follow along step by step, first open Copernicus Browser. Then to visualise Sentinel-2 imagery:
- Zoom to the desired area on the map or use the search bar (San Vito Lo Capo, north-west Sicily)
- Select the date of interest (‘2025-07-27’ selected below).
- Select the layer of interest (‘True color’ by default; SWIR selected below).

By identifying the last available image before the fire and the earliest image after it in which the full burn area is visible, it’s possible to establish the location and timeline of the fire.
This allows us to report the following finding: “Satellite imagery reveals the extent of the damage caused by wildfires across the Capo San Vito peninsula on Sicily’s northern coast between July 20 and July 27, 2025.”
Extra exercise: Look up a recent fire (e.g., wildfires near Penco, Chile in January 2026), navigate to the affected location and try to visualise the burned area using Copernicus Browser.
Quantifying the Burned Area
The visibly scorched area can be measured using the Area of Interest tool (highlighted below), which allows users to draw a polygon on the map and calculate the total area in square kilometres. (Once drawn, keep the polygon in the editor, as it will be used again later.)

Reportable finding: “The wildfire that swept across Sicily’s Capo San Vito peninsula in 2025 burned more than 50 km2 of the peninsula, according to Sentinel-2 data.”
Repeatedly measuring the burned area over time allows you to follow the progression of a fire. This method was used by Bellingcat when covering the Etosha National Park wildfire in late September 2025.
Extra exercise: Replicate the analysis of the Etosha National Park fire from this Bellingcat article.
Assessing Burn Severity
Some fires only affect surface vegetation, while others scorch the ground and cause long-lasting damage. Burn severity can be measured using an index called the Normalised Burn Ratio (NBR).
How Does the Normalised Burn Ratio (NBR) Detect Burned Areas?
The spectral response of a material describes how reflective it is to different types of light. The graph below shows the difference between healthy vegetation and bare soil in terms of the amount and types of light they reflect.

By focusing on the NIR and SWIR bands, where reflectivity differs significantly between healthy vegetation and bare soil left after a burn, an index can be calculated:
NBR = (NIR – SWIR) / (NIR + SWIR)
A high NBR indicates healthy vegetation, while a low NBR indicates burned areas.
Copernicus Browser doesn’t include a default NBR layer, but it can be added via a custom script, as shown in the screenshot below:
- Select ‘Custom’ in the layer selector.
- Switch from the ‘Composite’ to the ‘Custom’ tab.
- Check ‘Load script from URL’.
- Paste this URL: https://bellingcat-scripts.ams3.cdn.digitaloceanspaces.com/NormalizedBurnRatio.js
- Load the script by clicking the green circular arrows to the right of the URL.
- Click ‘Apply’ (you may need to scroll down).
Alternatively, you can skip these steps and go straight to the custom NBR post-fire image here.

The NBR layer displays positive values in green (healthy vegetation) and negative values in purple (burned areas), making the boundary of the scorched area much clearer than before.
To calculate the change in NBR in Copernicus Browser, use the Statistical Information tool (a free account is required to access this feature).
- Within the date selector, choose a date a few weeks or months after the fire.
- Using the Area of Interest polygon, select the ‘Statistical Info chart’ icon.

- Set the maximum cloud cover to around 30% using the slider in the top right.
- Select a date range that captures the available data surrounding the fire (July 20-27 shown below).
- Identify when the fire occurred on the graph (this will be marked by a sharp drop in the NBR, as shown below).
- Hover over the points on the graph immediately before and after the fire to display the mean value.

In this example, the pre-fire image had an average NBR of 0.11 and the post-fire image had an average NBR of -0.18. The NBR decreased by 0.29, which represents a moderate burn.
| Severity Level | Change in NBR |
| Unburned | Less than 0.100 |
| Low | 0.100 – 0.269 |
| Moderate | 0.270 – 0.659 |
| High | 0.660 or greater |
Reportable finding: In late July, the fire, which scorched more than 50km2 of Sicily’s Capo San Vito peninsula, was deemed moderately severe according to the US Forest Service guidelines.
Extra exercise: Find a custom visualisation script of interest from this repository and explore what it does.
Wildfires in Conservation Areas
By focusing on protected sites such as nature reserves and national parks, we can begin to assess how wildfires affect areas of high conservation value. Controlled burns are widely used in agriculture and land management, but unchecked fires in protected areas risk eroding fragile ecosystems.
The proportion of the Zingaro Nature Reserve that was damaged by the fire can be estimated by combining the NBR image created in Copernicus Browser with a dataset from Protected Planet, a global map of protected areas that includes nature reserves.
QGIS, a program for working with geographic data, is well-suited for this type of analysis. Download and install QGIS on your computer. For help with this step, refer to the QGIS installation guide.
To download the NBR image from Copernicus Browser:
- With the NBR visualisation selected, click the ‘Download’ icon.
- Switch tabs at the top from ‘Basic’ to ‘Analytical’.
- Change the image format to ‘TIFF (32-bit float)’.
- Change the image resolution to ‘HIGH’.
- Change the coordinate system to ‘Popular Web Mercator (EPSG:3857)’.
- Toggle the ‘Clip extra bands’ switch to the off position (see image below).
- Select the ‘Custom’ layer check box (and deselect any others).
- Click ‘Download’.
- Wait. It could take several minutes for the image to be generated and downloaded.

Once the image has downloaded, rename it to NBR.tiff to make it easier to work with.
Next, open QGIS and click ‘New Project’ in the upper left.
Load the image from Copernicus Browser by dragging and dropping the downloaded file into QGIS.
Useful QGIS Terminology
CRS – The Coordinate Reference System describes how the world should be measured and projected. Two of the most common are:
EPSG:4326 – WGS 84, which uses latitude and longitude as the unit of measurement.
EPSG:3857 – WGS 84 / Pseudo-Mercator, which uses metres as the unit of measurement.
Raster – a type of data that uses pixels to represent information (such as satellite imagery)
Vector – a type of data that uses points, lines, and polygons to represent information (such as a burn area polygon).
Processing the NBR Image
Next, we categorise each pixel in the NBR image as burned or unburned.
Previous analysis in Copernicus Browser showed that the Zingaro Nature Reserve’s NBR value dropped below zero only after the fire (before image: mean NBR value on July 20, 0.11; after image: mean NBR value on July 27, -0.18).
We can use this analysis to set a threshold; anything below zero will be categorised as burned.
The QGIS Raster Calculator lets us apply our threshold to the NBR image and create a new layer.
Open the Raster Calculator by selecting ‘Raster > Raster Calculator…’ from the menu bar at the top.

The Raster Calculator lists the raster bands available in the project. In this example, there are five. These bands are set by the custom script we used in Copernicus Browser and are numbered as follows:
- Red
- Green
- Blue
- Pixel validity (not used in this example)
- NBR index
To create a new raster layer that applies our threshold on the NBR index band:
- Double-click the fifth band (ending ‘@5’) to add it to the expression box at the bottom.
- Add < 0 using your keyboard (shown above).
- Select the ‘Create on-the-fly raster instead of writing layer to disk’ checkbox.
- Click ‘OK’.
The expression NBR@5 < 0 tells QGIS to categorise NBR index values as burned if they are less than zero.
The new layer shows burned areas as white (a value of 1), and unburned areas as black (a value of 0).

Extra exercise: Download an NBR image captured before the fire. Use the Raster Calculator to create a new layer that shows burn severity.
Adding Conservation Area Data
Download the Zingaro Nature Reserve dataset from Protected Planet by selecting ‘Download > File Geodatabase’.
As before, drag and drop the downloaded file into QGIS. This time, the download is a zip file and contains many PDF files as well as the geodatabase file of interest. Scroll down to the bottom of the list and select the ‘gdbtable’ file with a polygon icon on the left side (see the blue highlighted row below), then press ‘Add Layers’.

This adds the nature reserve polygon as a layer in QGIS (and gives it an arbitrary colour). The nature reserve is almost completely contained within the white burned area, indicating it was heavily affected by the wildfire.

Quantifying the Burned Area in the Nature Reserve
To measure the proportion of the nature reserve that was burned by the wildfire, we will use the Zonal Histogram tool from the QGIS Processing Toolbox to count the number of unburned and burned pixels within the reserve polygon.
Open the toolbox with ‘Processing > Toolbox’, and a pane should open to the right. In the Processing Toolbox search field, look up ‘Zonal Histogram’ and double-click the result to open the tool.
To create a new layer:
- Set the ‘Raster layer’ to the threshold burn area layer (NBR@5 < 0)
- Set the ‘Vector layer containing zones’ to the nature reserve polygon layer (should start with ‘WDPA_’).
- Click ‘Run’
- Click ‘Close’

This will create a new layer called ‘Output zones’, which is a copy of the nature reserve polygon with pixel counts added.
Select the output layer in the lower left and click ‘Attribute Table’ in the upper right. (The attribute table is a spreadsheet-like view of the data contained in a layer.)
For the output layer, there is just one row because there is only one polygon. If the layer contained many polygons, there would be many rows.
The newly calculated counts are added to the end of the table, so scroll all the way to the right. Look for fields starting with ‘HISTO_’. Here, HISTO_0 is the count of unburned pixels (value of 0), and HISTO_1 is the count of burned pixels (value of 1).

To calculate the proportion of burned area, the number of burned pixels is divided by the total number of pixels.
Proportion = 57413 / (57413 + 2195) = 0.96318…
A value of 0.96318 means that just over 96.3% of the nature reserve burned.
Reportable finding: In late July, more than 95% of the Zingaro Nature Reserve burned in a wildfire, according to Sentinel-2 satellite imagery and Protected Planet data.
Tracking Past Wildfires
To assess the significance of an ongoing wildfire, it is important to place it in historical context. How does it compare with previous fires in the same area? Is it part of a seasonal pattern, or does it represent an unusually severe event?
With coverage dating back to 2008, the European Forest Fire Information System (EFFIS) automatically maps wildfires across Europe, North Africa, and parts of the Middle East.
Fire data can be requested directly from EFFIS using web form, with results delivered by email. For ease, you can also download Bellingcat’s archived copy of EFFIS wildfire data for Italy covering 2015–2025.
For this section, it is best to open a new QGIS project.
To view and analyse historic wildfires in the Zingaro Nature Reserve using EFFIS data:
- (Optional) Add the OpenStreetMap layer from the XYZ Tiles category by double-clicking it.
- Load the EFFIS data into QGIS. If prompted to select a coordinate transformation, click ‘OK’ to accept the default option.
- Load the Protected Planet Zingaro Nature Reserve polygon as described earlier.
- Open the Vector Intersection tool by selecting ‘Vector > Geoprocessing Tools > Intersection…’ from the menu bar at the top.

The Intersection tool creates a new layer containing only the fires that affected the Zingaro Nature Reserve. To create the new layer:
- Set the ‘Input layer’ to the EFFIS fires layer.
- Set the ‘Overlay layer’ to the Zingaro Nature Reserve polygon layer.
- Click ‘Run’.

QGIS functionality can be extended through plugins, including Data Plotly, which adds data visualisation tools. To install Data Plotly, open the Plugin Manager by selecting ‘Plugins > Manage and Install Plugins…’ from the menu bar, then:
- Search for ‘Data Plotly’ in the available list.
- Select the plugin from the search results.
- Click ‘Install Plugin’ to download and install it.

Once installed, open the Data Plotly panel with ‘View > Panels > DataPlotly’. The panel should appear on the right-hand side of the QGIS window.
To plot a graph of historic wildfire activity within the nature reserve, configure Data Plotly as follows:
- For ‘Plot type’, choose ‘Bar Plot’.
- Set the ‘Layer’ to the newly created ‘Intersection’ layer.
- In ‘X field’, type “year(initialdat)”. This expression extracts the year from the fire’s approximate start date, allowing events from the same year to be grouped together.
- In ‘Y field’ enter “$area/1000000”. This expression calculates the burned area within the nature reserve in square kilometres.
Note: EFFIS data provide initial and final dates for each fire, which are approximate because they depend on the availability of satellite imagery. These dates should be treated as bounds for when a fire occurred, rather than as the dates when it started and ended.
Next, switch to the Layout tab in Data Plotly:
- Untick ‘Show Legend’. Only do this for simple plots where a legend is not required.
- Add a title and labels for the X and Y axes.
- Finally, click ‘Create Plot’ and wait a few seconds for the chart to be generated.

The chart shows that the Zingaro Nature Reserve has experienced several significant wildfires over time. However, in 2025, the data show that the fire burned a larger area within the reserve than the major fires recorded in 2020 and 2017.

Reportable finding: The Zingaro Nature Reserve has experienced three major wildfires since 2015. Of these, the 2025 fire burned a larger area within the reserve than those recorded in 2020 and 2017.
The tools and methods in this guide can be applied to wildfires in many other regions. By combining satellite imagery with environmental and historical datasets, it’s possible to move beyond detection and begin to quantify a fire’s impact. In doing so, you can also place individual incidents in context, revealing whether they are part of a recurring pattern or an unusually severe event.
To learn more about fire detection, see Bellingcat’s guide to NASA FIRMS.
To explore QGIS further, visit the Bellingcat toolkit entry on QGIS.
Merel Zoet and Claire Press contributed to this report.
This guide contains modified Copernicus Sentinel data (2025), processed with Copernicus Browser, as well as data from the European Forest Fire Information System (EFFIS) of the European Commission Joint Research Centre.
Bellingcat is a non-profit and the ability to carry out our work is dependent on the kind support of individual donors. If you would like to support our work, you can do so here. You can also subscribe to our Patreon channel here. Subscribe to our Newsletter and follow us on Bluesky here, Instagram here, Reddit here and YouTube here.
The post Burning Forests: Tools for Tracking and Reporting Wildfire Damage appeared first on bellingcat.
30.06.2026 à 00:34
Satellite Imagery Shows Scale of Venezuela Earthquake Damage
Conflict and Human Rights Team
At least 1,719 people are reported to have died after two devastating earthquakes struck northwestern Venezuela last week. The final casualty count is expected to rise significantly. Some media outlets report resident’s growing frustration with the Venezuelan government and its recovery efforts. Sky News on June 29 reported that the United Nations Coordinator for Humanitarian […]
The post Satellite Imagery Shows Scale of Venezuela Earthquake Damage appeared first on bellingcat.
Texte intégral (1249 mots)
At least 1,719 people are reported to have died after two devastating earthquakes struck northwestern Venezuela last week.
The final casualty count is expected to rise significantly.
Some media outlets report resident’s growing frustration with the Venezuelan government and its recovery efforts.
Sky News on June 29 reported that the United Nations Coordinator for Humanitarian Affairs in Venezuela was preparing for as many as 10,000 deaths.
Social media posts, news reports and drone footage have been shared in recent days, proving vital sources for many Venezuelans (both in the country and living abroad) who are searching for information about loved ones who remain missing.
Social media pages have been set up listing many of those who are yet to be accounted for. Others have contacted Bellingcat asking if apartment blocks relatives were staying in are still standing.
Bellingcat has received satellite imagery from Planet Labs PBC that shows one the worst affected areas in the country, including collapsed buildings and apartment blocks in La Guaira.
Readers can move laterally and vertically to observe the full image in the interactive below as well as zoom in on specific areas to assess the damage. A share button on the top right will copy a shareable link to the zoomed in area.
Scroll and zoom to see damage throughout the affected Venezuelan coast. Toggle between English and Spanish. Share a link to a specific location by clicking the button on the top right. The before imagery is from Jul 30, 2025 and Dec 12, 2023. After imagery is from Jun 27, 2026. SkySat imagery via Planet Labs PBC.
The high resolution image covers a 14-mile stretch of Venezuela’s northern coast from the towns of Catia La Mar to Caraballeda, which have been among the worst impacted.
Other areas to be significantly impacted but not included in the imagery above include Caracas, Maracay, Valencia, Barquisimeto and Yaracuy.
We have compared the satellite imagery we obtained with previous images captured before the earthquake to identify which parts of this 14-mile stretch of coastline to show changes since the quakes.
Readers can toggle between the imagery captured on June 27 (five days after the Jun. 24 quakes) and a composite of reference images taken on Jul. 30, 2025 and Dec. 11, 2023 (before the quakes).
Zooming in on specific areas reveals the scale of the damage.
For example, several buildings seem to have been flattened in the below before and after images showing the Playa Grande area.


Before imagery (left) of Playa Grande is from Feb 27, 2026. Imagery from after the earthquake (right) is from Jun 26, 2026. SkySat imagery via Planet Labs PBC.
The Planet Labs imagery also confirms significant destruction in the town of Carabelleda.


Before imagery (left) of Carabelleda is from Jun. 19, 2026. Imagery from after the earthquake (right) is from Jun 27, 2026. SkySat imagery via Planet Labs PBC.
Another area, Macuto, has been significantly impacted as well.


Before imagery (left) of Macuto is from Mar 20, 2026. Imagery from after the earthquake (right) is from Jun 27, 2026. SkySat imagery via Planet Labs PBC.
Footage taken on the ground and posted to social media also displays the devastation.
A minute-long video filmed on a 500-meter section of José María España Avenue in Carabelleda shows as many as a dozen collapsed buildings, most of them high-rises. This drone footage gives an aerial look of the destruction of at least six apartment blocks in the same area.
Another video shared on social media showed a collapsed hotel in Macuto, between Carabelleda and La Guaira.
Other open source information about the damage in cities such as Caracas, Valencia and beyond can be found on this site where individuals are uploading images and videos detailing damage.
While international rescuers continue to arrive in Venezuela, the threat of aftershocks remains.
Reuters also reports that engineers fear many buildings that remain standing could be vulnerable and are requesting an audit of state housing.
Carlos Gonzales, Jake Godin and Miguel Ramalho contributed to this report.
Bellingcat is a non-profit and the ability to carry out our work is dependent on the kind support of individual donors. If you would like to support our work, you can do so here. You can also subscribe to our Patreon channel here. Subscribe to our Newsletter and follow us on Bluesky here, Instagram here, Reddit here and YouTube here.
The post Satellite Imagery Shows Scale of Venezuela Earthquake Damage appeared first on bellingcat.
27.06.2026 à 20:02
Poster Boy: Sanctioned Kinahan Cartel Lieutenant Found Playing Padel in Dubai
Financial Investigations Team

This article is the result of a collaboration with The Sunday Times. You can find their corresponding piece here. Every Friday evening, the brochure says, players can compete to win cash prizes in one of the world’s fastest-growing racquet sports. The padel club in Dubai’s west is the picture of modern wellness culture: climate-controlled courts, […]
The post Poster Boy: Sanctioned Kinahan Cartel Lieutenant Found Playing Padel in Dubai appeared first on bellingcat.
Texte intégral (4514 mots)
This article is the result of a collaboration with The Sunday Times. You can find their corresponding piece here.
Every Friday evening, the brochure says, players can compete to win cash prizes in one of the world’s fastest-growing racquet sports. The padel club in Dubai’s west is the picture of modern wellness culture: climate-controlled courts, a private sauna and ice bath, and one-on-one coaching. The promotional image shows a bearded man in mid-swing, eyes locked on the ball. He wears matching activewear and a golden tan. The poster boy for padel is a talented player who once finished runner-up at an international tournament. He has also spent the past decade living in the shadows.

Ian Thomas Dixon is a key figure in the Kinahan cartel, the Irish organised crime group that authorities say has evolved into a US$1.5 billion transnational network involved in drug trafficking, money laundering and arms smuggling. Investigators have connected the cartel to Iran’s intelligence services and the Lebanon-based militant group Hezbollah. Its feuds with rival gangs have been linked to at least 18 murders across four countries.
Dixon, 36, along with the Kinahan Organised Crime Group’s senior leadership – Christy Kinahan, 69, and his sons Daniel, 49, and Christopher Jr, 45 – was sanctioned by the US government in 2022. Authorities allege the Irishman acted as a trusted lieutenant to Daniel Kinahan, who is said to manage the cartel’s vast drug trafficking operation by helping move bulk cash across Europe, arranging payments and keeping tabs on money owed by a narco-trafficker.

Bellingcat and The Sunday Times can today reveal how Dixon’s racquet sport hobby has left behind a digital trail that led to the most recent footage of him since those sanctions were imposed – the first time he has been pictured publicly in almost a decade. This investigation also uncovers the alias Dixon has used in Dubai and exposes the first open source links to an underworld associate who was recently extradited from the Gulf state and jailed in Scotland.
It comes as cartel leader Daniel Kinahan awaits extradition to Ireland after his arrest in Dubai on foot of a warrant issued by Irish authorities. The arrest, in April, followed an extensive policing and diplomatic effort from international law enforcement.

In March, investigations by Bellingcat and The Sunday Times exposed the first photographs of Daniel Kinahan and his father in years and also revealed that the cartel’s “friend”, former UFC fighter Mounir Lazzez, was connected to US sanctions against Iran.
The latest findings give an unprecedented glimpse into the recent activity of a key cartel associate who, until now, has largely flown under the radar.
Family Ties
When cartel founder Christy Kinahan moved to Spain after his release from an Irish prison in 2001, it wasn’t long before his new home became a hub for the gang. His sons, Daniel and Christopher Jr, soon followed him to the Costa del Sol – as did their younger cousin, Dublin native Ian Dixon.
From the late 2000s onward, Dixon worked for businesses linked to the crime family in the south of Spain. One of these was The Auld Dubliner, a pub in Estepona that reportedly served as a base of operations for the cartel. In 2010, the pub was raided and temporarily closed by authorities as part of Operation Shovel, a years-long multi-national police investigation into the cartel’s drugs and arms-trafficking activities.

Dixon would also work as a trainer at MGM Marbella, the boxing gym co-founded by Daniel Kinahan that would go on to represent some of the biggest pro boxers in the world. The company, which was renamed MTK Global, shut down after the US sanctions on the Kinahans were imposed in April 2022.

In 2016, Dixon was arrested by Spanish police investigating the murder of Irish criminal Gary Hutch. The previous year, Hutch had been gunned down while out for a morning jog in a gated community on the Costa del Sol.
Dixon was released without charge, and another Kinahan cartel associate was later sentenced to 22 years for his role in the murder. The killing sparked a feud between the Kinahans and the rival Irish Hutch gang that resulted in at least 18 deaths.
Dixon and other key Kinahan members fled to Dubai in the wake of the deadly feud.
Ian Dixon has no known convictions. But his alleged role in the Kinahan Organised Crime Group was laid bare when the US sanctioned him. Authorities said Dixon managed finances and moved bulk currency for Daniel Kinahan and also kept tabs on the debt owed by a narco-trafficker.
The sanctions notice also said Dixon controlled Hoopoe Sports LLC, a Dubai firm that listed a number of pro boxers among its clients and reportedly received more than $4 million for bouts involving former heavyweight champion Tyson Fury. Boxing promoter Bob Arum told Yahoo Sports the money was for consulting fees owed to Daniel Kinahan.

Dixon lived in an exclusive gated community in Dubai, according to the 2022 sanctions notice. Online listings show that properties like his Spanish-inspired villa are worth up to $2.7 million.
Passion for Padel
Padel is an increasingly popular racquet sport from Mexico best described as a combination of tennis and squash. According to the sport’s governing body, it has more than 17.5 million weekly players across 150 countries and the UAE, where Dixon lives, has the second-highest number of padel courts in Asia. It was on these courts in late 2024 that Dixon played in the master final of the Asia Pacific Padel Tour (APPT).
APPT rankings show Dixon registered for the tournament under the name “Ian Thomas”. Like his cartel leader relative Christy Kinahan, who used his first and middle names as an alias on his Google review profile, Dixon had dropped his surname.
Finding a Fugitive – How we Located Dixon
Bellingcat found the padel club promotion showing Ian Dixon after running images of the cartel associate through a publicly available facial recognition search engine. Among the results was a link to a graphic designer’s online portfolio, which included the advertisement for the padel competition. The original photo had been posted on the sports club’s Instagram page in late 2023, with the caption: “Elevating fun, one swing at a time!” Dixon was not named.

We searched for additional open source evidence and located online profiles for a 36-year-old Irish padel player named “Ian Thomas” who had taken part in a number of matches in Dubai in recent years. One profile shows he played 16 ranked matches between September 2024 and April 2026 – the most recent being the week after Daniel Kinahan’s arrest. But the accounts did not include profile pictures.

Bellingcat searched for footage showing the padel events and venues listed on the profiles. It returned multiple social media posts and live-streams clearly showing Ian Dixon at the same events where “Ian Thomas” was registered as playing. Dixon can also be heard speaking with a Dublin accent and at one point is seen with a close relative of Daniel Kinahan.
Dixon and his doubles partner played four games over the December 13-15 weekend, eventually placing second after losing in the final. The Irish cartel associate is captured on film after the match receiving a silver medal and commemorative racquet.
The Asia Pacific Padel Tour was held a month after senior Kinahan cartel figure Sean McGovern was arrested in Dubai on foot of an Interpol red notice. McGovern was extradited to Ireland last year and earlier this month jailed for 24 years for directing the activities of a criminal organisation in relation to murder and attempted murder.
The tournament was live-streamed to YouTube via webcams set up on two courts. Dixon was captured throughout the three-day event, both playing on the court and mingling with others in the background. The hour-long male amateur final, which Dixon lost, is viewable in its entirety.
Dixon also posed for photos during the tournament, but it appears he did have some reticence about appearing on social media. In two images from a different padel event hosted at the same venue a few months later, Dixon’s face had been covered. However, a third photo was not edited, confirming that it was Ian Dixon.
Kingpin in the Crowd
Among the people Dixon was seen with at padel events in Dubai was Stephen Jamieson, a Scottish criminal who was recently jailed for his role in a multimillion-dollar drug trafficking operation.
Dixon greeted Jamieson with a fist pump during the Dubai APPT tournament in December 2024 on the day the Irishman played in the amateur final.

Dixon was also pictured with Jamieson at a family day padel event just weeks before the Scottish criminal’s arrest. (Bellingcat is not publishing details of that event to protect the identity of family members.)
Jamieson, who has multiple convictions, was extradited from Dubai last year and is serving a six-year prison sentence in Scotland on organised crime and drug charges. The case against him was built around intercepted messages he had sent via the defunct encrypted communication network EncroChat – a network the Kinahans have also used – to direct drug shipments.
The Sunday Times reports today on the Kinahan cartel’s deeply entrenched links to organised crime in the UK, where it is known to control much of the illicit drug market. It said the footage showing that Dixon and Jamieson know each other could indicate an underworld connection, since cartel cadres do not associate with rival operations.

Three of the seven alleged key Kinahan cartel figures have been arrested since the US sanctions were imposed. Johnny Morrissey, arrested in Spain in 2022, was later bailed and subject to a travel ban. Sean McGovern was jailed earlier this month and Daniel Kinahan awaits extradition to Ireland after his recent arrest in Dubai. Garda Commissioner Justin Kelly, of Ireland’s police force, recently said the investigation into the Kinahan cartel was ongoing and that authorities were continuing to focus on the other members of the gang.
Ian Dixon did not respond to questions from Bellingcat.
Connor Plunkett, Peter Barth, Beau Donelly and John Mooney contributed to this article.
Bellingcat is a non-profit and the ability to carry out our work is dependent on the kind support of individual donors. If you would like to support our work, you can do so here. You can also subscribe to our Patreon channel here. Subscribe to our Newsletter and follow us on Bluesky here, Instagram here, Reddit here and YouTube here.
The post Poster Boy: Sanctioned Kinahan Cartel Lieutenant Found Playing Padel in Dubai appeared first on bellingcat.
25.06.2026 à 15:59
How to Use AI to Help Find Civilian Harm
Miguel Ramalho
Between February 2022 and September 2025, Bellingcat staff and volunteers collected, geolocated, and shared more than 2,500 incidents of civilian harm following Russia’s full-scale invasion of Ukraine. As part of this effort, Bellingcat tested a new machine learning model intended to rank Telegram social media posts on their likelihood of containing incidents of civilian harm. […]
The post How to Use AI to Help Find Civilian Harm appeared first on bellingcat.
Texte intégral (3956 mots)
Between February 2022 and September 2025, Bellingcat staff and volunteers collected, geolocated, and shared more than 2,500 incidents of civilian harm following Russia’s full-scale invasion of Ukraine.
As part of this effort, Bellingcat tested a new machine learning model intended to rank Telegram social media posts on their likelihood of containing incidents of civilian harm.
This novel methodology dramatically reduced the search and selection time required, freeing researchers to focus on verifying incidents of civilian harm – not just searching for them.
This piece documents our methodology, ethical considerations and lessons learned in the hope that others researching similar topics can benefit from our work.
Open source research into civilian harm is still a relatively new field and it presents many challenges – one of the biggest is organising and sorting through the huge volume of user generated content being produced to find what is relevant.
Machine learning, a form of artificial intelligence that uses algorithms to identify patterns from large amounts of data and make predictions, can make this task more efficient.
With ongoing conflicts involving large amounts of civilian harm occurring in Sudan, and much of the Middle East, this guide aims to offer those covering these conflicts an example of how machine learning can be used to help find and sort incidents. You can also access the Code Notebook for our model here.
We defined “civilian harm” not just as civilian deaths or injuries resulting from armed conflict, but also the broader and delayed effects on civilians from mental trauma, loss of livelihood, displacement, destruction of infrastructure and more. This definition was informed by the Protection of Civilians book on civilian harm.
Initial Telegram Dataset
Each Telegram post containing civilian harm which had already been manually verified by researchers was used to build an initial dataset of confirmed cases of civilian harm, which data scientists call positive instances. We collected a total of 5,848 unique URLs for these Telegram posts. For our manual collection we reviewed posts on relevant Telegram channels, working through oldest to newest posts each day. Assuming that a given post made it to our geolocated incidents list, it meant the researcher who flagged it also looked at the posts that appeared before and after it on Telegram and did not flag those ones, so we selected the 10 posts surrounding the verified civilian harm post as our additional dataset of posts that did not contain civilian harm. After excluding any deleted or duplicate posts, we ended up with 48,545 non-civilian harm posts, our negative instances.
The choice to overrepresent negative instances aims at better reflecting the real world and increasing data available for model training.
We enriched each URL with metadata from the Telegram API, such as the time of publication, reactions or textual content. As some of these posts had been deleted, we completed the missing data points with previously preserved versions from our Auto Archiver database, only available for the positive instances.
Feature Engineering
Training a machine learning model requires numerical data, as these models compute a prediction score based on mathematical operations.
We built these by converting raw data from our initial dataset, such as keywords signalling potential civilian harm, into numerical scores (or “features”) that the model could interpret, with the aim of increasing the model’s ability to identify patterns. This process, known as feature engineering, can significantly improve model results because it allows data scientists to suggest explicit context knowledge.
A full list of features we used to train the model can be found in the code notebook accompanying this piece. Many features were directly inspired by researchers’ input from their experiences manually screening cases of civilian harm by sorting through a set number of Telegram channels and inspecting each post individually.

Several of the features used were directly built from the metadata contained in each Telegram post including media_type, day_of_week; or binary ones: forwarded, edited and reply_to.
Other features included engagement information: views, forwards, total_reactions, and even individual features for most used emojis including the reaction_crying_face to count  emoji.
Converting Text to Numbers
To embed the experience from the manual collection process, researchers put together a list of keywords both in Ukrainian and Russian that, to them, signalled posts likely to show civilian harm. For instance, “Шахед” and “КАБ” translated to “Shahed” and “Guided aerial bomb” respectively. We created a numerical feature to count their frequency.
In addition, we included several generic English-language keywords which meaningfully signalled potential civilian harm, such as “injured”, “school affected” and “hospital affected” that were only used for generating semantic similarity scores.
A semantic similarity score is a calculation used to determine the proximity in meaning between different words and phrases. To get the semantic similarity between the post text and each of our keywords, we represented each in a list of numbers via a Sentence Transformer model, which converts words into numerical representations called vectors that a computer can understand.
We then calculated the level of similarity between each vector using cosine similarity, one of the most popular methods for measuring similarity between two pieces of text.

Due to how embeddings work, this calculation results in a figure on a scale from -1 (no semantic proximity) to 1 (same meaning). For example, the words “hurt” and “injured” would have a high similarity score, while “residential” and “injured” would have a negative score as the words are not semantically similar.
Finally, to enable the model to identify the relevance of each post to civilian harm in Ukraine, we used a multilingual text transformer from the BERT family of language models to represent the entire post’s text as a vector of 768 numerical values. This model can efficiently represent text from many languages in a way that captures meaning: the same sentence in different languages will generate similar embeddings, and trained machine learning models can detect patterns in the embeddings.
It is important to note that for this initial prototype of a civilian harm detection model, we did not include any features derived from media content such as photos and videos, although that would be a logical next step in attempting to improve model performance.
Selecting, Training and Evaluating Models
With 54,393 rows of 893 numerical features each, we selected four machine learning algorithms to train our predictive models.
We chose Logistic Regression as a baseline algorithm due to its simplicity. We also selected three other “best in class” models, Random Forest, XGBoost, and LightGBM. These choices centred on the interpretability of the models and their ability to work on tabular data of this size. For example, we avoided neural networks due to a lack of interpretability and because those models work best with a larger dataset.
To genuinely assess the performance of the trained models, we split our dataset into three parts:
- A training set – the data the models were trained on (60 percent of the full dataset’s rows)
- A validation set – used for an intermediary evaluation when tuning model parameters (20 percent of all rows)
- A test set – hidden for the final performance assessment, so the models were evaluated on unseen data (remaining 20 percent of rows)
We used a stratified split to divide the dataset instead of a random split. This method ensured the proportion of positive instances (i.e. confirmed cases of civilian harm) remained consistent across all three sets at about 11 percent.

To measure the performance of machine learning models, we ran them through the test set and measured the number of correct and incorrect predictions. Models output a likelihood between 0 and 1 that each Telegram post contains civilian harm, and we tried to find a cut-off threshold that leads to a good balance between flagging almost every post (0.1) or flagging very few (0.9).
There are two main types of evaluation metrics to gauge a model’s prediction power. Recall asserts what fraction of positive instances (i.e. known civilian harm posts) were correctly flagged as such. Precision measures the fraction of posts flagged as civilian harm that are indeed civilian harm posts.

During the training phase, we tuned the models to maximise average precision (PR-AUC), a metric that summarises precision across all recall levels. While this method also accounts for precision, it prioritises recall, which is preferable for this use case as it steers model selection to reduce the number of civilian harm posts that are skipped.
The following table sorts models from best to worst PR-AUC against a baseline of a coin-flip predictor. ROC-AUC and F1 are two other evaluation metrics included as sanity checks. Simply put, ROC-AUC measures the probability of ranking two instances, one negative and one positive, correctly; F1 balances precision and recall equally and its best cut-off threshold value.

From these results, we selected XGBoost as our final model as it had the best scores when compared across all metrics.
Interpreting the Model

Because these models are interpretable, we can understand which features are the most useful when predicting whether a post includes civilian harm. The above table shows the top 10 features that most strongly signal the XGBoost model to make a decision:
- semantic_keywords_similarity: the semantic proximity between the post text and manually selected keywords “casualties”, “damage” and “civilian harm”
- bert: the model was able to discern meaning from the text with the same strength as some of the other features in this list – there are three cases of this in the top 10
- reaction_crying_face: reactions with crying face emojis on the post
- group_of_messages: whether a post contains multiple media files
- keywords_in_text: the number of custom Ukrainian or Russian keywords in the post
These results generally tally with what you might expect when selecting Telegram posts for instances of civilian harm, including that posts that generate a lot of emotional engagement and posts using keywords about civilian harm were among those most likely to contain content related to this topic. Not all models had the same top features as XGBoost. In fact, for the Random Forest model the most important feature was the number of crying face emojis present in a post, a soft pattern highlighted by researchers when this methodology was first imagined.

LLM Results and Comparison
Retroactively, we decided to run a sample of the same test dataset through different large language models (LLMs) to gauge their ability to make these same predictions.
We aimed to include an LLM-generated score as an extra feature for our trained models, which would be captured as relevant if it correlated with the correct predictions.
To start, we selected two local models, the 1B and 4B variants of Gemma 3 from Google DeepMind, and two cloud-hosted models, Gemini 2.5 flash and Gemini 3.5 flash. With this selection, we hoped to compare results across a wide range of models’ expected performance.
We generated a 400-row stratified sample (preserving the same proportion of real civilian harm instances) from the test dataset used for the custom models. For each of the four LLM models, we ran two tests: one where only the Telegram post message was sent, and another including both the message and the engineered features (excluding the text embeddings, as the model had direct access to the text). In the prompt for each model, we asked for a score between 0 and 1. We then evaluated the results as we did for the custom models.

The above table shows that LLMs can indeed extract value from the engineered features. All four LLMs surpassed the baseline Logistic Regression model in our tests, yet none of them performed better than the other custom-trained models, and XGBoost remained the one with the highest PR-AUC.
Still, Gemini 2.5 Flash performed better than its newer version 3.5 and even achieved a slightly higher best F1 score than any other model. While this is a good result, for the flagging of civilian harm posts, the PR-AUC remains the crucial metric, as it captures the model’s ability to identify infrequent instances of civilian harm while minimising false positives.
Ethical Considerations
Introducing an instrument of automated decision-making into a process of detecting civilian harm brings inherent ethical questions. These include automation bias, or how humans tend to blindly place faith in machine-generated recommendations; algorithmic bias, or how the results of these models echo the same patterns present in the training data, including under- or over-representation of types of civilian harm.
The decision to test an automated methodology for this particular project came from the fact that there were limited resources for both steps in the process – the detection of potential civilian harm and its actual verification. Historically, we built an enormous backlog of unverified incidents because a lot of time had to be spent on monitoring the most recent events so that potential evidence would be captured and preserved as soon as possible.
The automation of this process also reduced the exposure of researchers to a significant amount of unpleasant and distressing visual and text content, reducing the burden of exposure to traumatic content.
For this project, we tried to ameliorate the ethical challenges with a number of strategies including randomly flagging posts not captured by any model, monitoring which features models relied on to make decisions, and by doing historical comparisons of patterns in data.
Additionally, as stated above, for this initial prototype of a civilian harm detection model we did not include any features derived from the media content itself. In the future, it would be a logical next step in attempting to improve the model performance, to include the media from the posts – but using AI to review actual media comes with additional ethical challenges such as model bias.
Because of the opaque ownership of many LLM companies and their generative nature, the use of LLMs for an extra feature presented additional ethical challenges including privacy and safety concerns considering the sensitive nature of the data. Our model did not rely on LLMs, though we retroactively ran a sample through it.
How the Model Fits into the Bigger Picture
After selecting this model, we created a user interface where researchers could view a list of Telegram posts sorted from most to least likely to contain indications of civilian harm. The user interface was designed for quick triage and integration, where a positive confirmation from researchers would instantly send the post to the Auto Archiver (Bellingcat’s tool for preserving digital content) and then transfer it to ATLOS (our internal collaborative verification platform). Bellingcat staff and volunteers could then manually verify incidents. Researcher input was constantly stored so that this data could be used to improve the model in the future.
Preliminary feedback indicated that the AI model was useful. Not only were we able to reduce time and harm from scouring through dozens of war reporting Telegram channels, researchers also reported that the stream of new posts being added to the verification backlog were capturing real and diverse cases of civilian harm.
Despite the focus on civilian harm and Telegram (highly popular in Ukraine and Russia), this pipeline is generic and can be adapted to other conflict monitoring tasks. How easily this can be done does depend on how open the social media platform is and whether it is possible to scrape posts from it. Apart from that, it is easy to incorporate new features and data, and cheap to automatically retrain, test and deploy models as the system receives more human input.
Looking forward, sorting through overwhelming amounts of data in a conflict will continue to be challenging. Hopefully, this methodology can help newsrooms, conflict monitoring organisations, and others find the balance between ethical considerations and resources in order to carry out open source investigations on civilian harm and human rights violations.
Bellingcat is a non-profit and the ability to carry out our work is dependent on the kind support of individual donors. If you would like to support our work, you can do so here. You can also subscribe to our Patreon channel here. Subscribe to our Newsletter and follow us on Bluesky here, Instagram here, Reddit here and YouTube here.
The post How to Use AI to Help Find Civilian Harm appeared first on bellingcat.
18.06.2026 à 10:59
Super-Potent Synthetic Opioids Spread Across US Amid Fentanyl Crackdown
Jonathan Moens
This article was co-published with Signal Ohio and STAT. In high school, Ashley Delgado dreamed of becoming a doctor and one day buying her father a Rolls-Royce. “She wanted to heal people,” said her father, James Taylor. She had a high GPA, Taylor added, and did especially well in science and Latin. In her mid-20s, […]
The post Super-Potent Synthetic Opioids Spread Across US Amid Fentanyl Crackdown appeared first on bellingcat.
Texte intégral (4960 mots)
This article was co-published with Signal Ohio and STAT.
In high school, Ashley Delgado dreamed of becoming a doctor and one day buying her father a Rolls-Royce. “She wanted to heal people,” said her father, James Taylor. She had a high GPA, Taylor added, and did especially well in science and Latin.
In her mid-20s, Ashley suffered a leg injury and was prescribed OxyContin. The painkiller marked the beginning of a yearslong descent through addiction — from prescription opioids to methamphetamine, then heroin, and finally, fentanyl.
With her family’s support, Ashley spent time in a rehabilitation facility in her hometown of Cleveland, Ohio, and in recovery she moved into a sober living home. But on an early summer morning in 2023, Ashley’s body was found on a dead-end street just outside the city. One sandal was missing. Tucked inside her bra was a folded scrap of paper containing a tan powder. She was 29.

“I have lost my father, my grandmother — that hurts,” Taylor said. “But when you lose your child, that’s the worst thing on the planet, because they’re not supposed to go before you.”
Toxicology tests would later show a mix of substances in Ashley’s system, including protonitazene and metonitazene, powerful synthetic opioids from a little-known class of drugs known as nitazenes. Her death was ruled accidental.
Before his daughter’s fatal overdose, Taylor had never heard of nitazenes. Developed in the 1950s as potential painkillers, the drugs never reached the market because they were deemed unsafe for medical use. He was shocked to learn they could be up to 40 times more potent than fentanyl and 500 times stronger than heroin.
Nitazenes are predominantly sold online, both on the clear web and dark web, and are often laced into other substances to increase their potency. Experts say this puts unsuspecting users seeking more common drugs, such as oxycodone, fentanyl, or stimulants like cocaine, at risk of fatal overdoses.

The US Drug Enforcement Administration (DEA) started tracking nitazene-related seizures around 2014, but it wasn’t until 2019 that it saw a marked increase. Since then, federal authorities have scheduled dozens of nitazenes as illegal substances, launched undercover operations, filed indictments, and imposed tariffs on China, where many of the laboratories manufacturing and supplying nitazenes and fentanyl are known to reside.

Support Bellingcat
Your donations directly contribute to our ability to publish groundbreaking investigations and uncover wrongdoing around the world.
Yet, figures provided to Bellingcat by the United Nations Office on Drugs and Crime (UNODC) show the United States has reported 26 different kinds of nitazenes since 2019 — the second highest number globally, after Canada.
And data from the Centers for Disease Control and Prevention (CDC) on nitazene-involved overdose deaths suggest that cases continue to rise. More than 1,100 fatalities have been confirmed through the CDC’s State Unintentional Drug Overdose Reporting System (SUDORS), but experts believe the number of Americans who have died from them since 2019 could be as high as 2,000.
Alex Krotulski, the director of the Centre for Forensic Science Research and Education in Pennsylvania, told Bellingcat that deaths are underreported because nitazenes were not routinely tested for.
“There are only limited forensic toxicology labs that test for nitazenes, so if a nitazene was present and the lab didn’t test for it, the number wouldn’t appear in SUDORS,” he said. “Also, for labs that do test for nitazenes, they have missed cases prior to their testing.” The most recent years for which there is CDC data, 2023 and 2024, show they were the deadliest, with 747 confirmed deaths.

In this months-long open source investigation, Bellingcat combed through dozens of criminal court proceedings, filed national, state, and county-level Freedom of Information requests, and obtained scores of medical examiner reports to produce the most detailed account yet of how nitazenes are infiltrating US borders and destroying lives.
The investigation found that, despite efforts to curb their spread across the country, nitazenes are proliferating online. It also shows that, by the time nitazenes reach American users, they are almost always mixed with several other drugs, including methamphetamines, cocaine and, most notably, fentanyl.
As of this year, 48 of 50 US states have reported nitazene seizures.
Less Fentanyl, More Nitazenes
Fentanyl is by far the biggest opioid killer in the US. With more than a quarter of a million deaths since 2021 and about 200 fatalities a day, fentanyl is one of the country’s most urgent public health crises. But drug experts warn that nitazenes can be even more potent and are being mixed with fentanyl and other substances, creating increasingly lethal combinations.

“We’re always concerned about fentanyl being mixed in with other drugs — cocaine, meth, heroin,” said Frank Tarentino, Associate Chief of Operations for the DEA’s Northeast Region. “You add nitazenes to that and it makes it exponentially more dangerous and frightening for drug law enforcement, parents, caregivers, educators, and the young.”
Data obtained from the DEA’s National Forensic Laboratory Information System (NFLIS) show reports of confirmed seizures of nitazenes rising sharply — from 43 positive tests in 2019 to almost 2,000 in 2024 (the most recent year for which figures are available). By March this year, more than 8,000 nitazene reports had been recorded since 2019. But experts said that not all laboratories can test for nitazenes — which come in many forms including powders, pills, and sprays — and many don’t feed into the NFLIS system, meaning these numbers are almost certainly an underestimate.
We asked the DEA for a breakdown of reports of nitazenes by state. Ashley Delgado’s home state of Ohio stands out. NFLIS data from 2019 to 2024 indicate that more than a third of all positive nitazene laboratory reports nationally are linked to Ohio.
Separate data from the CDC shows Ohio has also recorded the highest number of nitazene-related overdose deaths in the US since 2021. In 2020, there were just four fatalities linked to the drug; in 2021 that number rose to 90. Between 2022 and 2024, according to government data, there were 200 more deaths.
“It is a risk to our community,” said AmandaLynn Reese, chief programme officer at Harm Reduction Ohio, a non-profit that supports people who use drugs. “There’s been several instances of nitazenes being reported within the community, and I think we’re going to see more of that, especially as we’re seeing less fentanyl.”
To learn more about what was happening in Ohio, Bellingcat filed a public records request for county-level figures to the state’s Bureau of Criminal Investigation (BCI). The data shows that the counties of Scioto, Butler and Cuyahoga — areas long affected by the opioid crisis — account for almost half of all nitazene detections across the state, by weight.
In the 2000s, Portsmouth in Scioto County became known as the “pill mill capital” of America due to widespread overprescribing of opioids. More recent data continue to show Scioto with one of the highest rates of drug overdose deaths in the state. In Cuyahoga County, which includes Cleveland, drug-related mortality rates tripled the national average in 2022.
Two years ago, Ohio’s Governor Mike DeWine issued executive orders to schedule nine different nitazenes and legalised the use of tools to test for drugs including nitazenes.
The reasons why Ohio has been so hard hit are still not fully understood. “Ohio’s geography has long been a suspected contributing factor,” said Erin Reed, director of RecoveryOhio, a statewide initiative coordinating Ohio’s response to addiction. The organisation cited a 2001 article pointing to Ohio’s unique geographic and infrastructural features — including vast land, air and sea transportation networks — as key reasons for the state being a hub for drug trafficking.
Local organisations like Harm Reduction Ohio are pushing for more drug-checking services, education, and greater accessibility to testing strips and life-saving medications like Naloxone, a drug that is used to reverse an opioid overdose. “People are going to use drugs,” Reese said. “We don’t know the supply, but those are ways you can engage in your drug use to increase safety and reduce harm.”
Dealer’s Choice
Bellingcat obtained medical examiner reports from Cuyahoga County for all nitazene-related deaths in 2023 and 2024, which provide an insight into how the drugs are being consumed. The autopsy records show that 45 people — 31 men and 14 women aged 29 to 72 — died after taking nitazenes over the two-year period. Among them were university graduates and former athletes, an Army veteran, an ironworker and an addiction counselor.
Just before Christmas in 2024, a young man from Cleveland died after taking drugs that included etonitazene. A couple of weeks earlier, the body of an elderly woman was found in her home after she ingested drugs that included metonitazene and protonitazene. In the summer, a mother of two children in her thirties consumed a similar lethal mix. All except one of the 45 deaths was ruled accidental.
And in every instance, nitazenes were detected alongside fentanyl, and often with a cocktail of other drugs such as heroin, cocaine, methamphetamine and benzodiazepines. The reason for this wide variety, Tarentino, the DEA agent said, is that dealers often mix nitazenes into other drugs to make them more powerful and addictive, and ultimately to give them a competitive edge.
“It becomes a brand,” he said. “The unfortunate circumstance that we find ourselves in is that the dealer’s choice becomes a deadly decision.” Not only are these mixtures deadly — they can also be highly profitable.

Court records analysed by Bellingcat show nitazenes have been sold at prices ranging from roughly US $4,000 to $12,000 per kilogram. But Tarentino said the DEA’s internal estimate puts $12,000 at the lower end of the range, with prices going up to as much as $40,000. Given their potency, even small quantities can be diluted into hundreds of thousands — or potentially millions — of doses once mixed and pressed into pills. “A little bit can go a long way,” Tarentino said, “and they can make a lot of money.”
A Freedom of Information Act request to the US Customs and Border Protection (CBP) revealed that in 2024 and 2025 — the only years for which the agency has monitored nitazenes separately — 41 consignments of the drug were intercepted. The data shows that most of these shipments arrived by mail, primarily from mainland China, Hong Kong and the United Kingdom. The quantities tended to be small, ranging from less than 1 gram to almost 700 grams.

But that’s not always the case. An analysis of US federal court records linked to prosecutions of nitazenes indicates that roughly 90 kilograms of material containing nitazenes in different forms (powder and pills) have been seized over the past three years. Nearly two-thirds of that amount, about 60 kilograms, stem from a single case.
In that case, prosecutors allege that a man named Valkar Singh drove a blue Maserati from Canada into the US carrying six industrial-sized buckets with more than 100,000 pills containing isotonitazene. According to court filings, Singh transported the drugs to a Bronx, New York address, where he was arrested by undercover law enforcement officers.
Tarentino, who is familiar with the Singh case but could not comment on it specifically, said a lot of work is being done to prevent drugs being smuggled across the Canadian border. “Canada has become a major concern, but also a major partner in trying to stop the synthetic opioids that are coming into the United States,” he said.
Lawyers for Singh, who has pleaded guilty and is awaiting sentencing, declined to comment.

The scale of the alleged seizure makes this case an outlier. Of 46 federal cases identified by Bellingcat between 2021 and 2025, the next highest nitazenes seizure was about 9 kilograms. By comparison, data provided by the European Union Drugs Agency shows roughly 18 kilograms of nitazene-related seizures (pills, powder, liquid) across the EU between 2019 and 2023.
“It’s very large,” said Jared Brown, scientific affairs officer at the UNODC. “One hundred thousand pills is probably at the limit of what we hear about in terms of maximum types of quantities that get seized.”
Related articles by Bellingcat

The Rise of Nitazenes: Chinese Suppliers Behind Ads for Deadly Opioids Targeting Europe
The evidence suggests that most buyers are individual dealers who purchase relatively small quantities online, rather than organised criminal groups. “It’s street-level or mid-level dealers [in the US] that are introducing the nitazenes into the drug supply, not the big drug traffickers,” said Philip Berry, a visiting senior lecturer at King’s College London who formerly worked in counter-narcotics at the UK Home Office.
Court documents show that buyers can easily find nitazene suppliers online: on dark web marketplaces, standalone chemical supplier websites, or even on social media platforms. The suppliers often market the drugs by listing their chemical identifier and social media contact details. Often, the ads include an image of a young Asian woman striking a pose.
Buyers are often individual dealers who contact sales representatives via encrypted channels and negotiate a deal. In those conversations, representatives will sometimes disclose how they claim to evade customs, for example by declaring the product as cosmetics or electronic accessories.

A detailed account that illustrates this modus operandi comes from the 2023 case against a man named Will Catis in Florida — the state with the second highest number of confirmed nitazene reports. Court documents show that a basic internet search led Catis to multiple nitazene advertisements listed by Jiangsu Bangdeya New Material Technology Co., LTD, a Chinese company sanctioned by the US Treasury for offering illicit substances for sale, including fentanyl and protonitazene.
Catis purchased approximately four kilograms of nitazenes from Jiangsu Bangdeya in batches no larger than 500 grams. The drugs were sent via the US Postal Service to Deerfield Beach, Florida. Once received, Catis mixed the nitazenes with other drugs, pressed the substance into a brick and sold it to other drug traffickers. Catis was jailed for 12 years after pleading guilty to possessing and intending to distribute nitazenes.
One court case from Florida describes how a couple who lived in a converted garage bedroom in Hernando County bought nitazenes through the mail from Chinese companies they contacted online. Jacob Spinoza and his girlfriend Veronica Jo Barback regularly abused the drugs and distributed them locally, according to court documents. Both pleaded guilty. Spinoza was sentenced to nine years in prison, and Barback received a three-year sentence.

Another notable case reveals how a man allegedly ran a drug trafficking operation from a prison in Ohio. Investigators said Brian Lumbus Jr worked with a middleman, Giancarlo Miserotti, who contacted drug manufacturers in China to get nitazenes shipped through Italy to avoid custom checks. Once in Ohio, the plan was to distribute the drugs to other states, court documents said.
But law enforcement agents were listening in on conversations between Lumbus and other members of the drug network, who expressed caution about the potency of nitazenes. “Man, we got to be careful … somebody died,” Lumbus said in one phone conversation, according to court documents. “Ohhh … it was too strong,” Miserotti responded. “I think the ratio of the pink [metonitazene] was thick.”
Lumbus is awaiting trial. Miserotti was arrested in Italy in 2023 and sentenced to more than 13 years in prison.
Arms Race
Enforcement actions have targeted the online marketplace ecosystem. In June 2025, Archetyp Market, a major dark web platform used to sell drugs, was dismantled in a coordinated operation involving Europol. US authorities have also indicted several China-based companies and individuals accused of offering nitazenes and related synthetic opioids for sale. Still, advertisements for nitazenes continue to litter online markets, constantly adapting to new regulatory regimes.

In July 2025, China placed the majority of nitazenes under national control. Tightened regulations — both in China and the US — have tried to stem the flow of nitazenes. But drug experts warn that manufacturers are already exploiting loopholes in China’s regulations by marketing chemically similar synthetic opioids known as “orphines.”
Jared Brown, of UNODC, said orphines are also thought to come from China and are about as powerful as fentanyl. “Orphines have just enough of the molecule difference that it isn’t covered by the core definition that China has made,” he said.
This is not the first time Chinese synthetic opioid manufacturers have adapted to regulations. In 2019, China banned all fentanyl-related substances, including some major precursors. The number of distinct fentanyl analogues reported to the UNODC subsequently plummeted, while reports of nitazenes quickly picked up. Now that China is clamping down on nitazenes, orphines are on the rise. More than 150 cases involving orphines were reported in the US between 2024 and 2025, the majority of which are in Illinois.
“Always adapting, always changing – we call them ‘shape shifters’,” said Tarentino. “They’re this global Hydra that are always changing, evolving and adapting to their environment and taking full advantage of all of these different loopholes and vulnerabilities that exist.”
Reporting for this story was supported by the Fund for Investigative Journalism.
Bellingcat is a non-profit and the ability to carry out our work is dependent on the kind support of individual donors. If you would like to support our work, you can do so here. You can also subscribe to our Patreon channel here. Subscribe to our Newsletter and follow us on Bluesky here, Instagram here, Reddit here and YouTube here.
The post Super-Potent Synthetic Opioids Spread Across US Amid Fentanyl Crackdown appeared first on bellingcat.
12.06.2026 à 10:51
Heading Off: New Technique Helps Track Grain Smuggling Expansion to Libya
Bellingcat Investigation Team

On February 15, 2026, the bulk carrier, Grumant (IMO: 9385879) was pictured at the occupied Ukrainian Port of Feodosia on the Crimean peninsula. Satellite imagery suggests it had already been there for several days. It appeared to stock up on grain before departing on a two-month-long journey eventually docking at the Port of Benghazi in […]
The post Heading Off: New Technique Helps Track Grain Smuggling Expansion to Libya appeared first on bellingcat.
Texte intégral (6372 mots)
On February 15, 2026, the bulk carrier, Grumant (IMO: 9385879) was pictured at the occupied Ukrainian Port of Feodosia on the Crimean peninsula. Satellite imagery suggests it had already been there for several days. It appeared to stock up on grain before departing on a two-month-long journey eventually docking at the Port of Benghazi in Libya on April 18.
While there have been previous reports of grain shipments from occupied Ukraine arriving in Libya, this is only the second time a Russian ship has been observed delivering what the Ukrainian government describes as “stolen” grain to the country. The previous case involved the Damas Wave which travelled in January of last year to the port of Misrata which is under the control of the UN-recognised Government of National Unity (GNU). In addition to satellite imagery, Bellingcat deployed a new technique that analysed Grumant’s heading data which was contained in AIS information provided by Lloyd’s List Intelligence, to help confirm Grumant’s presence in Feodosia.
Bellingcat has been tracking smuggled Ukrainian grain shipments as they find new markets, five of the ships we previously identified have since been sanctioned by the EU while another was sanctioned by the US Department of Treasury.
Bosphorus Strait
Grumant transits the Bosphorus Strait in the middle of the night.
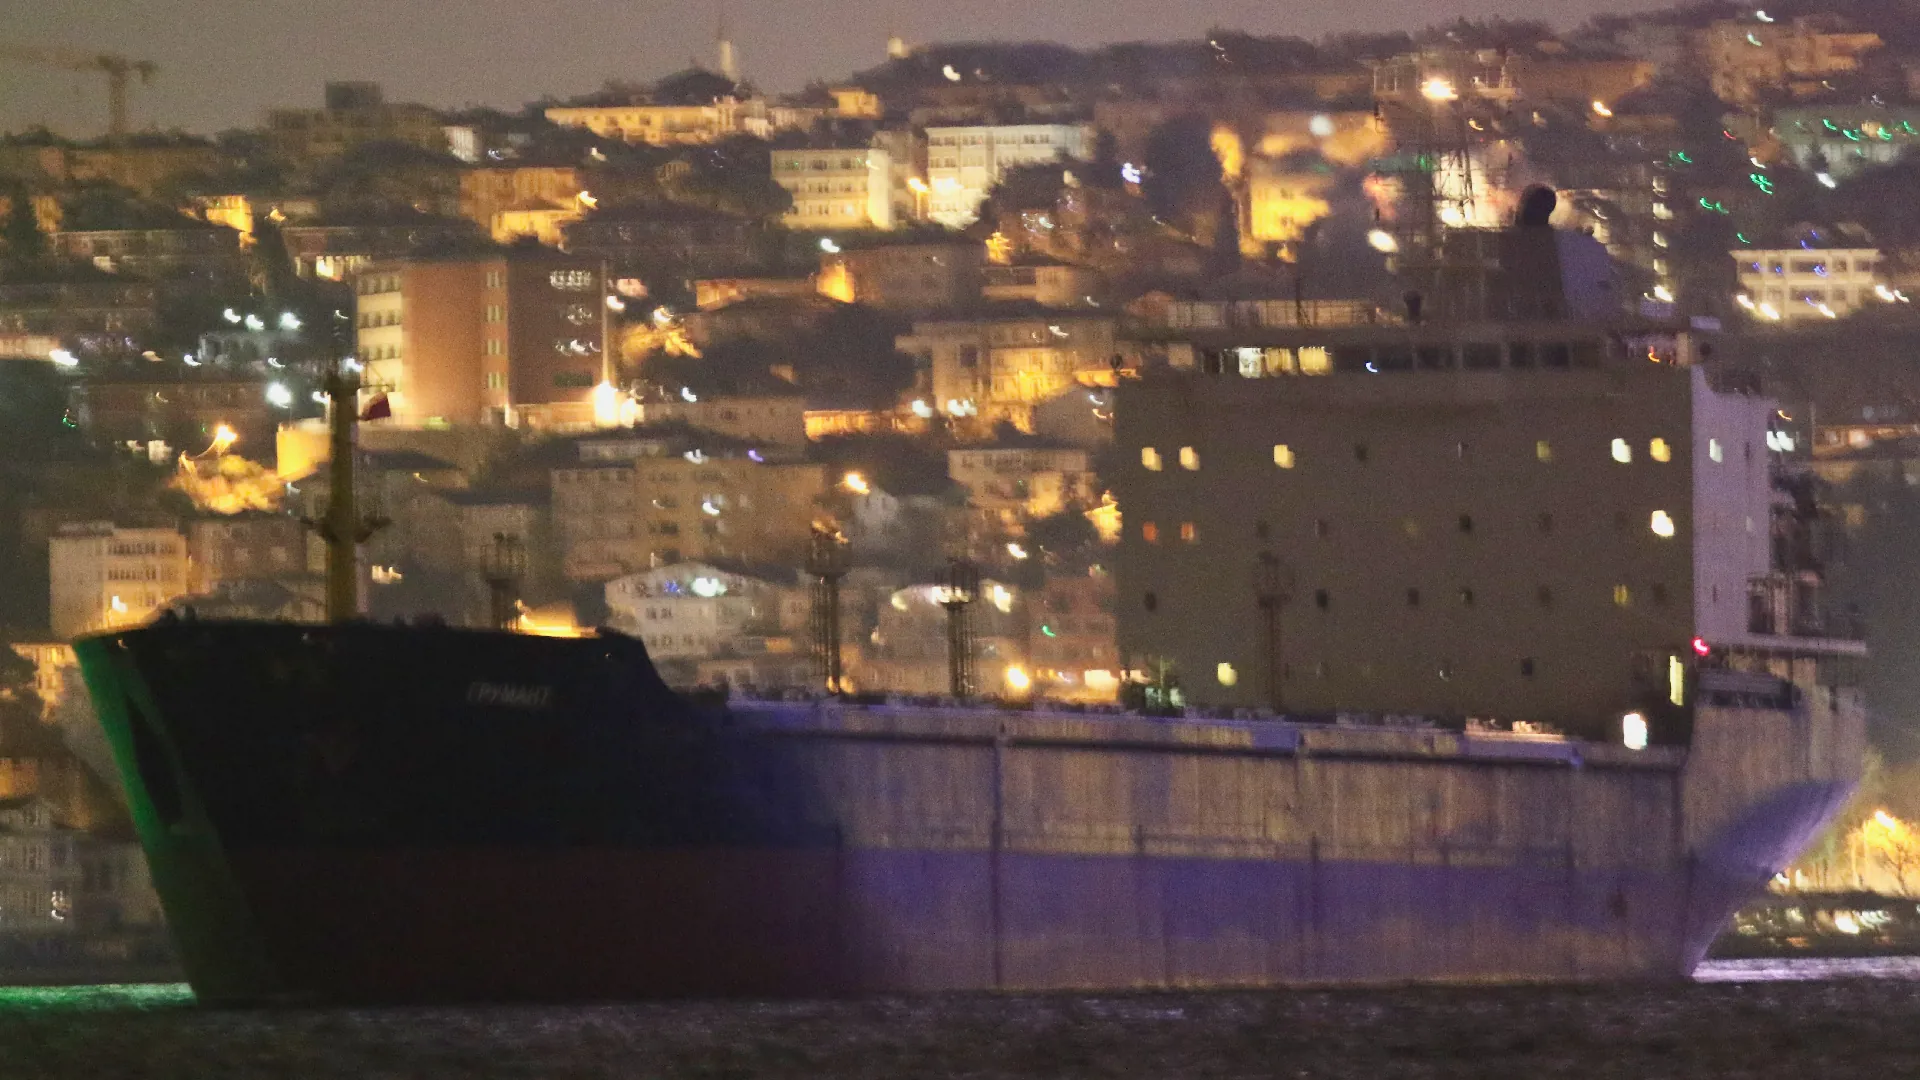
Credit: Yörük Işık.
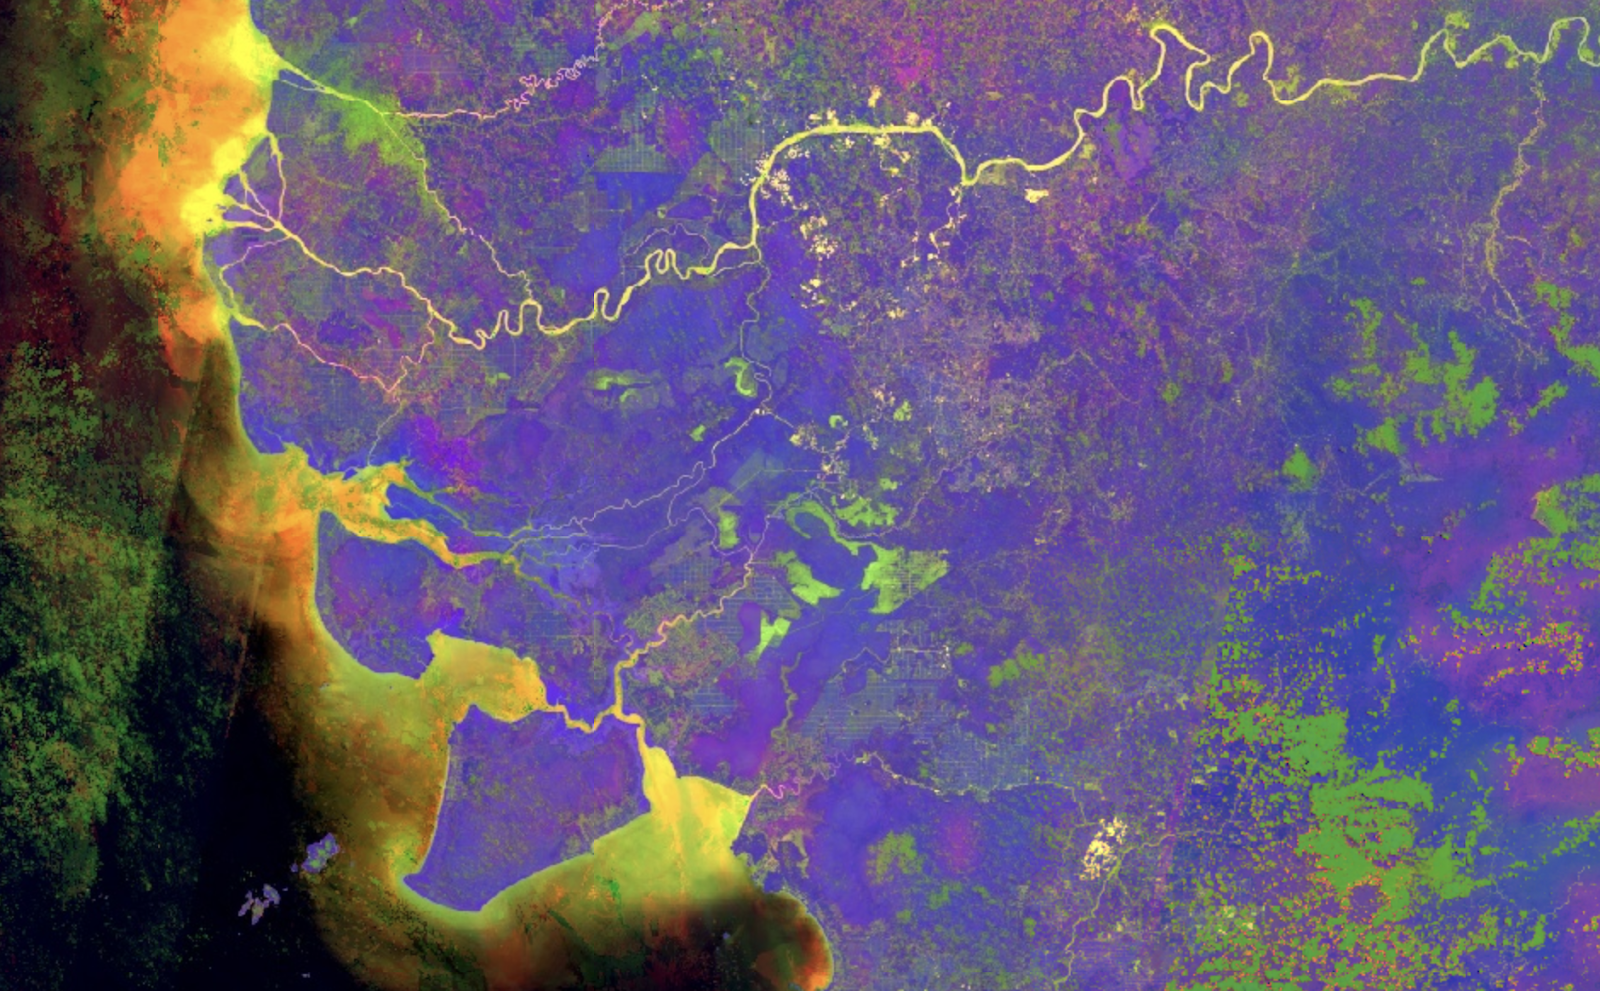
Black Sea
Grumant enters a region of the Black Sea known for GNSS interference, meaning that Grumant’s publicly reported Automated Identification System (AIS) position is unreliable.
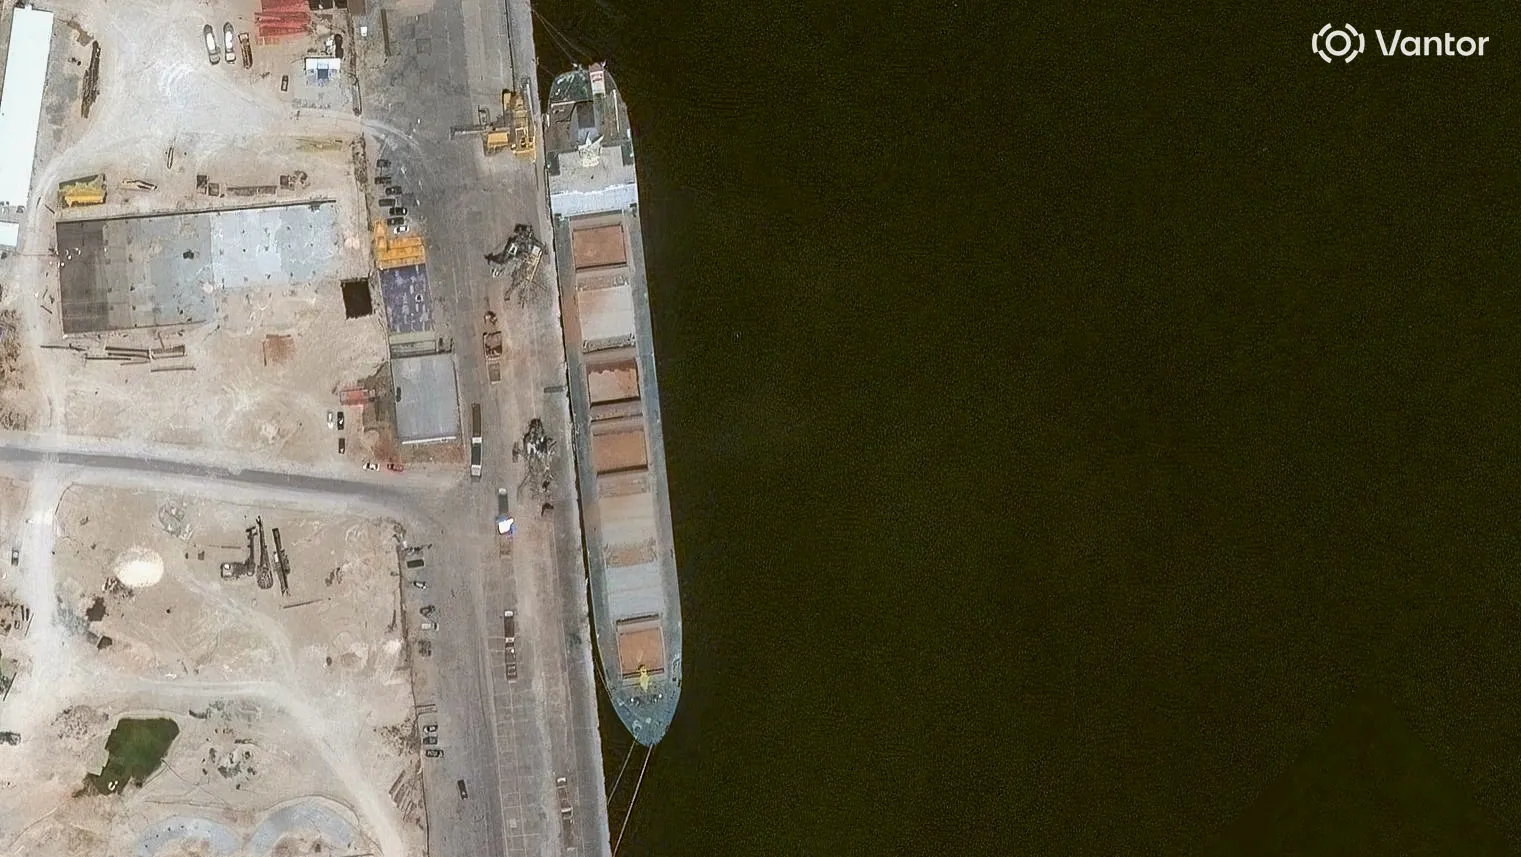
Port of Feodosia
On February 15, a high resolution satellite image confirms the ship is docked at the port of Feodosia at berth No. 1 that is used for bulk and metal cargo. Matching features visible include Grumant’s grey decking, its seven hatches and bright yellow front mast. What appears to be leftover grain can be seen under the two port crates, immediately next to the ship.
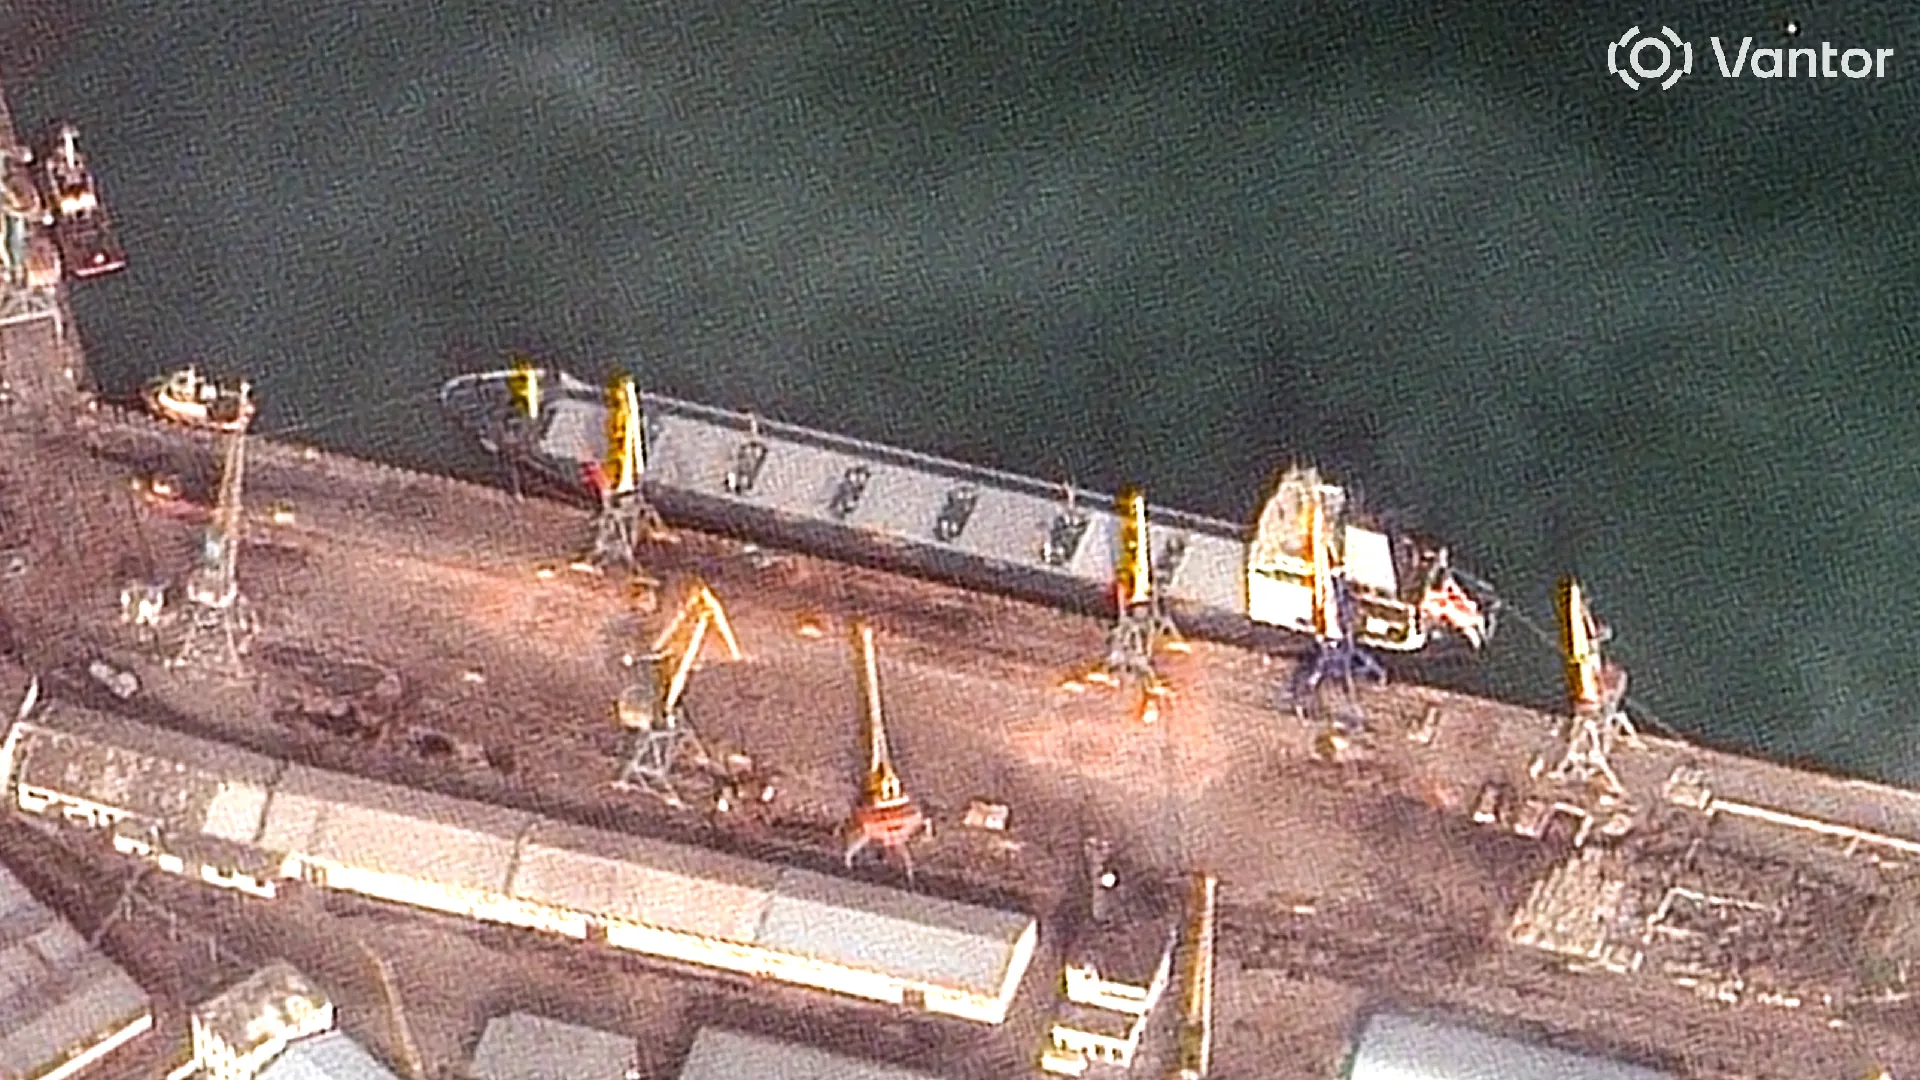
Credit: Satellite image ©2026 Vantor.
Black Sea
Grumant exits the area of signal interference, meaning that its reported position on ship tracking services is now reliable again. Its AIS messages indicate it is travelling towards the Bosphorus.
Bosphorus Strait
Grumant transits the Bosphorus Strait towards the Sea of Marmara. Judging by the draft, with no visible red paint on its hull, the ship appears to be fully laden.

Credit: Yörük Işık.
Izmir Anchorage
Grumant arrives in Izmir, Turkey on February 23 and anchors off the coast until March 13.
Over the course of three weeks, Grumant never enters the Port of Izmir. It is not known if it was denied entry. Bellingcat asked the port operators but did not receive a response before publication.
Credit: Planet Labs PBC.
Aliağa
Grumant then loiters off the coast of Aliağa, about 50 km from Izmir. It stays here until March 16, never entering the port. It again is not known if it was denied entry. Bellingcat asked the port operators but did not receive a response before publication.
Near Benghazi
Grumant arrives in Libyan waters and stays off the coast of Benghazi until April 1.
Libyan Waters
Grumant briefly leaves the coast of Benghazi, but returns a few days later.
Benghazi
Grumant leaves the anchorage on April 18 and docks at the port of Benghazi where it unloads the grain. The ship was captured in a Vantor satellite image on April 20.
It leaves port on April 23, and heads back towards the Bosphorus.
Credit: Satellite image ©2026 Vantor.
Bosphorus Strait
After spending a few days off the coast of Tuzla, Grumant transits the Bosphorus towards the Black Sea.

Credit: Yörük Işık.
Lloyd’s List Intelligence has previously reported on the expansion of Russia’s grain smuggling operations, beyond the occupied port of Sevastopol to include Feodosia port.
According to the Ukrainian activism, journalism and hacker group, Kiborg News, Grumant used deceptive shipping practices to deliver grain to Latakia, Syria in 2024. The report included several of Grumant’s shipping manifests, which showed it had repeatedly exported grain from Occupied Crimea to Syria.
Heading Data Helps Locate Grumant
It is standard maritime practice that ships broadcast Automatic Identification System (AIS) messages which include a ship’s position, heading, and draught (among other information).
Because of longstanding Global Navigation Satellite System (GNSS) interference in parts of the Black Sea, the position data transmitted by an affected ship’s AIS system is often unreliable.
Between February 7 and February 19, 2026, data from Lloyd’s List Intelligence shows the Grumant transmitted 29 AIS messages, with unreliable positions in the vicinity of Feodosia. We know these positions are unreliable as they are erratic and some of them report the ship as being positioned on land.

However, according to the IMO, the heading data transmitted by a ship’s AIS system must come from an onboard compass. A compass is unaffected by GNSS interference, meaning it is a more reliable source of information in these conditions.
Over the same dates, all 29 AIS messages reported the ship’s heading as 267 degrees or 268 degrees. The Port of Feodosia has a heading of 267.5 degrees. The close agreement between the ship’s heading and port heading strongly suggests that Grumant was moored at the port between February 7 and February 19, 2026.
We conducted an extra check of the heading data by reviewing satellite imagery available of berth 1 at Feodosia Port, which suggests that the same vessel was present on several days between February 6 and February 18. Imagery on Feb. 6 shows the port was empty in the morning and occupied in the afternoon. Grumant exited the area of GNSS interference on February 21, and berth 1 at the port was captured on satellite image on February 22 and appeared empty. The low resolution satellite imagery is only used as an additional check to see if a vessel is at the berth.


Bellingcat checked all vessels transmitting AIS in the vicinity of Feodosia Port and found that Grumant was the only one that consistently transmitted a heading matching the Port of Feodosia over the period of interest.
We shared our research with Charlie Brown, a former US Naval Officer and Senior Advisor at United Against Nuclear Iran where he focuses on maritime sanctions enforcement and the tracking of illicit shipping. Brown told Bellingcat that while satellite imagery of vessels remained key for identification, when looking for reliable data in a spoofing environment it made sense to look at the various elements of AIS data to try and find some accurate information, despite GNSS spoofing.
“It’s quite standard for the independent gyro compass to be providing the heading […] I think the majority would not [be subject to spoofing] so it’s a good methodology to parse out the particular data and then make some inferences from that.”
“It’s neat to think of what can be derived from data that would otherwise be dirty or wrong. So there’s still some elements of use in there.”
He added that in theory there are probably some compasses that are subject to spoofing as well.
He told Bellingcat that it was fair to say the heading data of the Grumant supported identification, but stressed the need to cross-reference with other data sources.
While in this instance it has been possible to use AIS data to help verify the location of Grumant, it is relatively unusual to have access to this information.
Ships that call to the occupied territories frequently disable their AIS transponders to do so.
This activity, known as “dark port calls”, is a common tactic for those engaging in illicit or sanctioned trades.
Grumant does not transmit AIS messages from February 8 to 11, but this is the longest gap in data (see diagram above), with intermittent messages coming through after that point.
It is unclear why Grumant continued to transmit AIS during the period it was loading in Feodosia.
A review of Lloyd’s List Intelligence data from January 2025 shows that on a previous voyage to the Black Sea the Grumant operated “dark” for 59 days.
Visual Identification
On February 15, 2026, high resolution imagery showed Grumant docked in the Port of Feodosia. We compared it with other recent images of Grumant to confirm the match.
The ship in the satellite image has a grey-coloured deck, which is uncommon enough for it to stand out. Many bulk carriers have cranes (including the ships we previously covered such as Krasnodar, Zafar and Zaid), Grumant does not have any. It also has seven hatches (openings for the grain) and a bright yellow front mast that matches the mast of Grumant (see the image of it transiting the Bosphorus). We can match the Grumant in the Feodosia image, not only to pictures of the Grumant shot from the ground, but also to the satellite image from Benghazi.
The length and breadth of the ship also matches that of the Grumant; 180 metres by 22.90 metres.


Libya’s Relationship with Russia and Ukraine
Libya has complicated internal dynamics with essentially two administrations in charge of different parts of the country – the Government of National Unity (GNU) in the west and the Libyan National Army (LNA) in the east.
In recent years, Russia has backed the LNA’s General Khalifa Haftar, based out of Benghazi, in the east of the country. But Jalel Harchaoui, a political scientist specialising in Libya with the Royal United Services Institute (RUSI), stressed that the two sides of this conflict, the LNA and the UN-recognised GNU, are not currently fighting. Instead they are in a flawed, multi-year truce.
Therefore, the east-west divide isn’t as clear-cut as during the civil war. While all shipments going to Benghazi and Tobruk are overseen by the LNA, not all shipments going to the city of Misrata (which is run by the GNU) are meant for the GNU-dominated part of the country.
Harchaoui told Bellingcat: “the Tripoli government is in some regards pro-Ukraine, but if there’s business that can be done with Russia through the very opaque port of Misrata and all the right people get paid, the business is going to take place.”
That observation is potentially significant given at least one previously tracked vessel that went from occupied Ukraine to Libya docked in Misrata.
This was not the case of the Grumant, however, which arrived in an LNA-controlled part of the country. It is not known from open sources alone if the authorities in Libya or at the port in Benghazi knew the grain carried by Grumant had come from occupied Ukraine.
Bellingcat contacted the Benghazi-based LNA government and representatives of the Tripoli-based GNU government via the Libyan Embassy in The Netherlands. We also contacted the Port of Benghazi, Port of Imzir in Turkey as well as the Ukrainian and Russian authorities. Representatives of the LNA did not respond to requests for comment before publication, nor did the Port of Benghazi or Port of Izmir. The Libyan Embassy in The Netherlands replied to Bellingcat after publication, stating that Benghazi and eastern Libya are not under the authority or administrative control of the Government of National Unity and therefore they are not currently in a position to comment on Bellingcat’s findings.
Ukraine Continues to Pursue the “Shadow Grain Fleet”
“The port of Feodosia, located in the temporarily occupied Autonomous Republic of Crimea, is not under Ukrainian control, and any commercial activity conducted there is illegal,” the Ministry for Development of Communities and Territories of Ukraine and the Ministry of Foreign Affairs of Ukraine told Bellingcat in a joint response.
They told us the loading of grain exported from the temporarily occupied territories is an illegal act and Russia was using ports as logistics centers to export stolen Ukrainian agricultural products.
“The expansion of such routes to third countries, in particular to North Africa, demonstrates Russia’s ongoing efforts to circumvent international sanctions and monetize resources stolen from the occupied Ukrainian territories.”
The Ukrainian Ministry of Foreign Affairs sent information about Grumant’s (IMO: 9385879) “illegal activities” to the diplomatic missions in Great Britain, the Republic of Turkey and the Republic of Tunisia over the course of March to May this year, the ministries told Bellingcat.
Ukraine is continuing to pursue legal action against Russia’s “shadow grain fleet” they told us. For instance, earlier this month a Swedish court approved the transfer of the Russian “shadow grain fleet” vessel CAFFA to Ukraine for investigation after it was arrested in Swedish waters.
This case has set a new precedent, going beyond sanction and fines previously handed out to such vessels, and allowing for the detention and confiscation of a shadow fleet vessel in European jurisdictions, the ministries said.
According to Russian court documents Grumant’s previous owner Murmansk Shipping Company was dissolved and “Decision/Reshenie” LLC were listed as the International Safety Manager and operator of Grumant. Decision/Reshenie were also listed as the operator of Grumant in another court document, from an unrelated case.
Bellingcat attempted to contact Decision/Reshenie to ask about Grumant’s grain shipment from Feodisia Port to Benghazi Port, but they had not responded at time of publication.
Youri van der Weide, Galen Reich, Yörük Işık and Bridget Diakun contributed to this report.
Cover image: Planet Lab image shows Grumant anchored off Izmir, Turkey on February 27. Credit: Planet Labs PBC.
Bellingcat is a non-profit and the ability to carry out our work is dependent on the kind support of individual donors. If you would like to support our work, you can do so here. You can also subscribe to our Patreon channel here. Subscribe to our Newsletter and follow us on Bluesky here, Instagram here, Reddit here and YouTube here.
The post Heading Off: New Technique Helps Track Grain Smuggling Expansion to Libya appeared first on bellingcat.
04.06.2026 à 14:27
Tracing Digital Links Between Viory and Ruptly
Lucy Swinnen
“In the age of misinformation, the line between fact and fiction is blurrier than ever.” “For those of us working in video news, verification isn’t a nice-to-have. It’s a necessity. It is how we protect the stories we help shape and how we earn and maintain trust in an increasingly chaotic information ecosystem,” Abu Dhabi-registered […]
The post Tracing Digital Links Between Viory and Ruptly appeared first on bellingcat.
Texte intégral (3700 mots)
“In the age of misinformation, the line between fact and fiction is blurrier than ever.”
“For those of us working in video news, verification isn’t a nice-to-have. It’s a necessity. It is how we protect the stories we help shape and how we earn and maintain trust in an increasingly chaotic information ecosystem,” Abu Dhabi-registered video news agency Viory posted on LinkedIn on April 9, 2026, offering training to help newsrooms and journalists sort fact from fiction.
The self-described “video news agency of the Global South” has delivered journalism training to multiple national press agencies across Africa, Asia and the Middle East.
However, when it comes to Viory itself, the line between fact and fiction is very blurry indeed.
Bellingcat has found multiple links between the digital infrastructure of Viory and Ruptly news agency, a branch of sanctioned Russian propaganda outlet Russia Today, including shared IP addresses, a Viory-linked site using a digital security certificate registered to Ruptly, and Ruptly sending site performance data to Viory. While there have been previous reports on suspected links between the two outlets, our investigation adds new evidence about Viory’s ties to Ruptly media.
When contacted for comment, both Viory and Ruptly denied any connection with each other.

‘Video News Agency of the Global South’
Viory’s main offering is raw video footage of news events provided via subscription. According to Viory, its clients include “major international news outlets, local media organisations, and independent creatives in more than 170 countries”.
If its own figures are to be believed, Viory was strikingly well established at its launch in November 2023, by which time it claimed to have a “pre-assembled team of over 150 full-time staff, and an established network of over 3,000 video journalists across the world”.
The name “Viory” is a trade name. The company’s legal name is Darpo Vision FZ LLC, according to its website, which also states that it is registered in Abu Dhabi. In August 2024, Darpo Vision FZ LLC filed for a trademark in the US for the name Viory, which was approved in December of 2025.
As of May 2026, Bellingcat found press releases and news reports referencing at least 30 agreements between Viory and partners in more than 22 countries, as well as cooperation agreements with government agencies, training agreements with universities and regional journalism bodies.
This includes:
- African Union of Broadcasting
- Mali’s Office de radiodiffusion et de télévision du Mali
- Democratic Republic of Congo’s Congolese Press Agency
- Public Service Media Maldives
- Namibian Broadcasting Corporation
- Ethiopian Broadcasting Corporation
- Cambodia’s Ministry of Information
- Media Office of the Government of Al Fujairah
- Abu Dhabi University
- University of Sharjah
- Asia Media Summit
Viory also sponsored a glitzy event for its inaugural Global South Video News Awards in December 2025 at Abu Dhabi’s first-ever BRIDGE Summit.
Ruptly Revisited
Ruptly is a video news agency formerly based in Berlin and ultimately controlled by Russia Today (RT), which is owned by Russian state media company ANO TV-Novosti. ANO TV-Novosti has been on the EU sanctions list since December 2022 for spreading “pro-Kremlin propaganda and disinformation” and supporting Russia’s war against Ukraine.
RT launched Ruptly, which operated in Berlin via a German-registered subsidiary in 2013, with the goal of “becom[ing] the go-to alternative resource in a highly concentrated market of professional news video footage, and to deliver coverage of stories that other agencies miss.”
Sanctions imposed on RT following Russia’s 2022 invasion of Ukraine choked off Ruptly’s source of funds in Germany, leading the German company to begin insolvency proceedings in October 2024. Ruptly continues to operate from Moscow as of 2026.
As with Viory, Ruptly’s main offering is providing raw news footage to subscribers around the world. It relies on a large network of international freelancers and stringers. In 2016 RT claimed that Ruptly had “surpassed” newswire services AFP and Reuters on YouTube, and was serving more than 600 media organisations in 45 countries.
Felix Huesmann of the German outlet RedaktionsNetzwerk Deutschland (RND), was the first to outline links between Ruptly and Viory while covering the insolvency proceedings of Ruptly. He found that Darpo Vision’s original details on the Abu Dhabi Creative Media Authority’s site included an email address d.toktosunova@gmail.com. It has not been confirmed who this email address belongs to; however, the username matches the first name initial and surname of Dinara Toktosunova, the managing director of Ruptly. When asked about this email address by Huesmann in 2024, Ruptly “explained that Toktosunova is focused on securing the future of the Ruptly team [in Moscow] and is not working anywhere else as a managing director.”The activist group, OSINT For Ukraine, also outlined links between Ruptly and Viory, including the movement of multiple key staff between the two organisations and strong similarities between the two organisations’ platforms and content.
Darpo Vision’s Security Certificate
The legal entity behind Viory, Darpo Vision, was set up in one of Abu Dhabi’s free zones – special economic areas that have business-friendly incentives such as tax exemptions and that allow 100 percent foreign ownership. The free zones also offer what some describe as high levels of “corporate privacy,” which others assert has created a haven for shell companies and opaque corporate structures.
Darpo Vision initially had its own web domain, darpo.vision. The site has since been removed. Whois records show that the domain was registered by Darpo Vision FZ LLC in December 2022 to a PO Box in Abu Dhabi, using a Russian domain name registrar and a Moscow phone number.
Initially, Darpo.vision had its own Secure Sockets Layer (SSL) certificate – a digital certificate that authenticates a website’s identity, allowing it to secure and encrypt data. However, VirusTotal data shows that as of at least June 2024, darpo.vision was using a wildcard SSL certificate registered to ruptly.video. A Wildcard SSL certificate is a single certificate with a wildcard character (*) in the domain name field. This allows the certificate to secure a single domain and multiple subdomains. You can see historical SSL certificates for darpo.vision.

James Wilson, a software and networking engineer with 20 years of experience and currently Enterprise Technology editor at Risky Business Media, told Bellingcat that to prevent unauthorised use or forgery of SSL certificates, a private key is needed to create and use a wildcard certificate across multiple domains.
“The fact that darpo.vision was using a wildcard SSL certificate for ruptly.video indicates that whoever was running darpo.vision also had access to the private key for ruptly.video’s SSL certificate. Normally, only the people operating Ruptly’s web hosting infrastructure would be likely to have access to that,” Wilson explained.
When asked by Bellingcat about whether there were alternative possible explanations, Wilson suggested that it was theoretically possible that someone may have hacked Ruptly and stolen their private SSL key.
“However, using that wildcard SSL certificate on a domain that didn’t match the wildcard in the certificate defies explanation as the browser would alert the user to the certificate error,” he added.
Shared IP Addresses
Bellingcat also identified multiple shared IP addresses which appeared to be concurrently in use by both Ruptly and Viory between May 2025 and May 2026.
From 2025 onwards, the Russian IP address 158.160.132.25 has been used concurrently by viory.video, ruptly.video, ruptly.agency and ruptly.tv, according to VirusTotal. Similarly, since the beginning of 2026, IP address 84.252.135.88 has been used concurrently by viory.video, viory.team, ruptly.video, ruptly.agency and ruptly.tv, according to VirusTotal.

VirusTotal data shows that from 2025 onwards, IP address 158.160.166.22 has been used by ruptly.video and viory.video while from 2026 onwards, IP address 158.160.226.68 has been used by viory.video and ruptly.tv. The VirusTotal data appears to show these IP addresses being used exclusively by Ruptly and Viory as of 2025 and 2026. However, VirusTotal does not necessarily capture all domains which resolve to an IP, and other domains may also have resolved to these IP addresses, which were not observed by VirusTotal’s passive DNS replication service. It is also important to note that in some cases, unrelated domains use the same IP addresses.
Ruptly Sends Site Performance Data to Viory
Viory’s and Ruptly’s site infrastructure was also linked through data sent via Sentry, an internal error tracking and performance monitoring platform.
An API scan of Ruptly’s main client login page, ruptly.agency, on March 26, 2026, shows that the page was sending data to a subdomain of viory.team. This domain appears to be used by Viory primarily for backend purposes, based on subdomains which appear to refer to common developer and site management tools such as Traefik and ArgoCD, in addition to Sentry.io. Notably, two subdomains also appear to refer to Ruptly.

The purpose of one domain sending data to another domain’s Sentry project is generally to consolidate all of the relevant performance and error data in one place for in-house developers to monitor.
The ruptly.agency page’s request to viory.team also includes an authentication key for Viory’s Sentry project. Ruptly.agency is not the only Ruptly domain sending Sentry data to viory.team. As of May 9, 2026 the login page for ruptly.video’s own Sentry project, sentry.ops.ruptly.video, automatically redirects to sentry.ops.ruptly.video/auth/login/viory/. Ruptly Video’s Sentry login page also features “Viory” as the title.
The ruptly.video Sentry login page is also sending data to the viory.team Sentry project, the ruptly.agency homepage and using a favicon hosted on viory.team.
A third Ruptly domain, ruptly.tv, also sends performance data to viory.team’s Sentry project via cms.dev.ruptly.tv.
James Wilson noted that in each case, the Ruptly domains sending data to Viory appeared to be using a different Sentry key.
“If you look at each of these snippets sending telemetry data [from the Ruptly domains], the specific Sentry keys for sentry.ops.viory.team are different for each. I presume that someone with access to Viory’s Sentry keys has generated and included fresh Sentry keys in each of these instances in order to differentiate between the telemetry from this site versus others using the same Sentry instance,” Wilson said.
“This cuts against the idea that this is, for example, a case of someone just lazily copy-pasting code on Ruptly’s domains. It suggests that each of these snippets was likely to have been deliberately included. The alternative explanation of changing these API keys to some arbitrary value seems much less plausible given the lack of diligence in ensuring other aspects of the content didn’t cross-reference the domains.”
‘Ruptly’ Page Title on Viory Test Page
Finally, Bellingcat found a page at frontend.dev.viory.video/en that appears likely to be a developer test page for the front page of Viory’s main domain viory.video.
Notably, however, the page title reads “Stream trending news | Ruptly.” The page description included in the source code also refers to Ruptly:
“Follow breaking world news in real-time and stream the latest developments in politics, sports, finance, science, tech, and more from one of the top online news sites. Download and share international news today with award-winning news agency Ruptl” [sic].

Wilson said that the use of the Ruply page title and text on the Viory test page “looks like a case of lazy copy and pasting”.
“That could potentially be done by someone outside of Ruptly, although it would be strange.”
While this particular piece lies on the lower end of the spectrum of proof, Wilson said that together with the other stronger pieces of evidence, including multiple Ruptly domains appearing to send data to Viory using different API keys, and Ruptly’s wildcard SSL certificate on Darpo Vision’s site, the weight of evidence for a connection between Ruptly and Viory adds up.
“None of the pieces of evidence are watertight on their own, but when you add them together it’s difficult to think of other plausible explanations for all of them being true at the same time,” he added.
“None of the pieces of evidence are watertight on their own, but when you add them together it’s difficult to think of other plausible explanations for all of them being true at the same time,”
-James Wilson
Bellingcat also found that Ruptly appears to have connections to a company in Hong Kong. Company records from July 2022 indicate that this company was originally named Ruptly Limited, but in September of that year, the company’s name was changed to Lotus Production Limited.
The Hong Kong company remains registered as active and filed annual reports in September 2025.
Russian Slant in the ‘Global South’
Anna Hiller, a Bangkok-based Consultant Research Analyst for the Institute for Strategic Dialogue told Bellingcat that the resources provided by Viory can be an attractive pool of source material for smaller media outlets, governments and academic institutions with small budgets.
She told Bellingcat that Viory’s editorial choices are clear when looking at the site’s videos.
“When accessing Viory, the prominence of pro-Russian and pro-China content is immediately noticeable, including numerous articles focused on Vladimir Putin, Russia-China cooperation, and broader China-related narratives.”
Bellingcat contacted Viory, Darpo Vision and Lotus Production Limited to ask about the connections we found between the Viory website and Ruptly and between Lotus Production Limited and Ruptly.
Viory said that it had no connection with Ruptly. “Viory has no connection with Ruptly; any suggestion otherwise based on ordinary use of similar digital platforms, tools or cloud providers is poorly founded and inaccurate; Viory is a UAE-based, privately held, self-funded and 100% privately owned organisation, and receives no funding, direction or instructions from any state media,” the company said in an email response.
Ruptly also said it was not connected to Viory. It declined to respond to Bellingcat’s questions, including about specific findings such as Ruptly’s domains sending technical performance and error data to Viory, calling these questions “irrelevant”.
Bellingcat is a non-profit and the ability to carry out our work is dependent on the kind support of individual donors. If you would like to support our work, you can do so here. You can also subscribe to our Newsletter and follow us on Bluesky here, Instagram here, Reddit here and YouTube here.
The post Tracing Digital Links Between Viory and Ruptly appeared first on bellingcat.
27.05.2026 à 11:41
The ‘Lost’ Villages of Myanmar’s Rakhine
Pooja Chaudhuri

A “river of blood” was how one survivor described the scene in western Myanmar. “I saw shooting. I saw mass killing.” Another told the UN High Commissioner for Human Rights (UNHRC) how 20 relatives, including three children, had been killed in the 2024 attack on Htan Shauk Khan village. Human Rights Watch (HRW) said earlier […]
The post The ‘Lost’ Villages of Myanmar’s Rakhine appeared first on bellingcat.
Texte intégral (12639 mots)
A “river of blood” was how one survivor described the scene in western Myanmar. “I saw shooting. I saw mass killing.” Another told the UN High Commissioner for Human Rights (UNHRC) how 20 relatives, including three children, had been killed in the 2024 attack on Htan Shauk Khan village.
Human Rights Watch (HRW) said earlier this month that the Arakan Army (AA) “may have killed at least 170 Rohingya men, women, and children” in Hoyyar Siri (known as Htan Shauk Khan in Burmese) in Buthidaung Township. It described the May 2, 2024, attack as a “massacre”.
Buthidaung is one of the two townships in Rakhine State that is home to the majority of the Rohingya, a mainly Muslim ethnic minority in the predominantly Buddhist Myanmar.
At least 40 villages in Buthindaung were burned down in April and May 2024 amid clashes between the AA, an ethnic armed group fighting Myanmar’s military junta for control of Rakhine, and junta forces battling to retain their hold of the township.
Both sides committed abuses against civilians during the clashes, according to HRW. The military junta’s forced conscription of Rohingya to fight on its behalf has also intensified violence against them.
The military and Rohingya armed groups began arson attacks in Buthidaung township in April 2024. By mid-May the AA had captured all junta bases, according to the think tank, the Australian Strategic Policy Institute. The destruction of Buthidaung has previously been documented by Bellingcat.
Support Bellingcat
Your donations directly contribute to our ability to publish groundbreaking investigations and uncover wrongdoing around the world.
The AA has denied accusations that it massacred civilians in Buthidaung, claiming that those killed were junta soldiers and Rohingya militants.
Bellingcat emailed the United League of Arakan, AA’s political wing, about the alleged attack on civilians but did not receive a response at the time of publication. Myanmar’s Ministry of Defence also did not respond to our questions.
Evidence of civilian harm in Myanmar is slow to emerge and difficult to obtain due to the military’s strict control of the region and the tight grip of armed groups such as the AA in areas they control.
“The mass killing could only be confirmed more than a year later,” the recent HRW report said, “when survivors eventually crossed into Bangladesh and found their way to the Rohingya refugee camps in Cox’s Bazar.”
Aerial imagery shows that Htan Shauk Khan was almost entirely destroyed in May 2024.

Erasing Homes
A new investigation by Bellingcat has identified 115 villages in Rakhine State, similar to Htan Shauk Khan, as partially or completely destroyed since the February 2021 military coup that overthrew Myanmar’s democratically elected government.
The data points to a pattern of violence that leaves civilian areas uninhabitable and in some cases, erases them completely.
Several buildings were set on fire when the junta allegedly dropped a bomb on the Muslim village of Zu La on Nov. 3, 2024. The fire was captured nearby on NASA FIRMS.
Satellite imagery indicates that it was attacked again on Dec. 9, 2024. Visible smoke can be seen rising from the village.
Zu La is located in Maungdaw Township. Along with neighbouring Buthidaung, Maungdaw is home to the majority of Myanmar’s persecuted Rohingya.
Zu La, and the neighbouring village of Gone Nar, previously faced violence during the 2017 Rohingya genocide.
Satellite imagery from that year shows them completely burned to the ground.
They show signs of reconstruction after 2017.
But repeated attacks in 2024 destroyed the villages again.
Neither of the villages appears on the latest maps from 2024. These are produced by the United Nations mapping unit, based on Myanmar government maps.
Steve Ross, Senior Fellow at the US nonprofit Stimson Center who is leading the ‘Crisis in Myanmar’s Rakhine State’ project, told Bellingcat this is part of the military’s broader campaign to deny the existence of the Rohingya and erase identity in Rakhine.
Bellingcat contacted the Myanmar government but had received no response by the time of publication.
Villages in Mungdaw are inured to cycles of violence. Ywar Haung, a village south of Zu La, has stood barren since 2017.
So has Kan Kya, where the military built the Border Guard Police Battalion No. 5 (BGP5).
All four villages are among the growing number of Rakhine’s lost settlements.
Six of the 10 villages we found partially or totally destroyed in Maungdaw in 2024 aren’t marked on the UN’s township map.
Removing more villages from the map remains a possibility, Ross said. However, following this April’s elections, which critics dismissed as a sham, the military is eager to restore international credibility and avoid actions that might be seen as provocative, the expert told Bellingcat.
The AA announced the capture of Maungdaw when it seized BGP5 on Dec. 8, 2024.
And with that the armed group gained full control of Myanmar’s entire border with Bangladesh.
Shortly afterwards, the AA took control of the strategically important Ann Township in central Rakhine.
The armed group announced it had captured the headquarters of the Western Regional Military Command on Dec. 18, 2024.
It shared a video of the headquarters and nearby military installations burning.
Local residents in and around the township were trapped, displaced or forced to flee their homes due to the months-long fight for Ann.
According to reports, the military entered Pyaung Chaung village and burned it down on Oct. 31, 2024.
Satellite imagery from Nov. 1, 2024, shows large-scale damage in the village. There were reports that the military warned residents to evacuate the village a week before the attack.
Ross believes that the military’s intention has been to try to make Rakhine as ungovernable as possible if the AA gains full control of the state.
Nearby villages of Yat Thar Ywar Thit
and Pyaung Thay show similar evidence of destruction.
Sittwe city, the capital of Rakhine State, has become a focal area of fighting since late 2025. The city is in Sittwe township, one of the three townships still under junta control.
Su Mon Thant, Asia-Pacific analyst at Armed Conflict Location and Event Data Project (ACLED), said capturing Sittwe would be highly symbolic for the AA as no non-state actor has yet taken control of a state capital in the country.
The AA already controls areas along an India-backed transport corridor in Myanmar that includes a port in Sittwe.
Sittwe is surrounded by water on three sides. Capturing it would be challenging, with the military maintaining naval superiority and building defences in and around the city to deter a potential AA offensive, Ross said.
On Dec. 27, 2024, the AA attacked the Kyauk Tan checkpoint near Sittwe on the highway linking the capital to Yangon, the largest city to the south of Rakhine.
There are many villages near the checkpoint.
Like Taw Kan
where, according to local reports, junta forces carried out an arson attack that destroyed 80 houses on Jan. 15, 2024.
Bellingcat found at least 13 villages near the checkpoint that had been destroyed, with only a few remaining structures. All but one of them were attacked in 2024-2025.
Less than 4km from the checkpoint is Yar Tan
which appears intact in a March 2024 Google Earth image
but several buildings look destroyed in high-resolution satellite image on Google Earth from March 2025.
Trenches and military outposts began appearing near the village around Nov-Dec 2024.
They grew as the months passed. However, due to a lack of updated high-resolution satellite images, we cannot tell whether these are currently in use or to what extent.
There are also villages that appear to have been replaced with defensive structures. For example, Kan Pyin Ywar Haung, for which the latest available high-resolution satellite image shows trenches on both sides.
Although such structures are clearly visible in high-resolution satellite imagery, lower-quality images can also help indicate whether a village was replaced with fortifications.
Kan Pyin Ywar Thit, located just south of Kan Pyin Ywar Haung, appears to have been completely destroyed; however, the same criss-crossing lines are not visible across the village.
Similar fortifications appear in other villages.
Defence infrastructure has replaced villages on the outskirts of Sittwe, making it more difficult for AA to advance towards the city, said Ross.
Bellingcat also found at least 10 villages partially or totally destroyed in Kyaukpyu Township since fighting intensified in February 2025.
Kyaukpyu, which has abundant oil, natural gas and marine resources, is also home to a junta naval base
As well as Chinese infrastructure projects that the AA fully or partially controls.
Nearly all the villages we found to be destroyed or damaged are within a 10km radius of the naval base.
In early March this year, clashes took place between the AA and the military near Say Maw village, located less than 5km from the base.
NASA FIRMS detected fire in the village and the surrounding areas on March 23, 2026.
The latest high resolution satellite image on Planet from April 2026 shows flattened buildings in the village.
A month earlier Saing Chon Dwein village, also less than 5km from the base, was reportedly burned down by the military.
The fire was caught on a Feb. 9, 2026 lower resolution satellite image
with burnt areas distinguishable the next day.
Like Sittwe, Kyaukpyu is surrounded by water, making it difficult for the Arakan Army, which lacks naval capabilities, to seize control. “AA has some advanced drones reportedly, but these areas also have jamming technology,” said Thant.
Methodology
The data was compiled using news reports, including social media channels, ACLED, satellite imagery and NASA FIRMS. The names of the villages were corroborated using the UN’s Myanmar Information Management Unit (MIMU), news reports and Planet Labs.
We only included areas where the destruction was clearly visible in high-resolution satellite imagery or significant enough to be detected in mid-resolution images. Our data is not exhaustive and the true number of affected villages is likely to be higher.
While it is difficult to ascertain whether the villages we found damaged or destroyed showed signs of reconstruction, at least five of them appear to show some buildings rebuilt in latest available satellite imagery.
Military Control Is Slipping
Last month, in the first election since Myanmar’s 2021 coup, the pro-military parliament chose junta chief Min Aung Hlaing to be the next president.
Subscribe to the Bellingcat newsletter
Subscribe to our newsletter for first access to our published content and events that our staff and contributors are involved with, including interviews and training workshops.
According to research group Data for Myanmar, at least 65 townships were excluded from voting, including the 14 in the AA’s control. In Rakhine’s 17 townships, voting was held in only three still under junta control – Kyaukpyu, Sittwe and Manaung.
The AA resumed attacks against the junta in Rakhine in November 2023, ending a year-long ceasefire.
Data published by the Armed Conflict Location and Event Data Project (ACLED) and analysed by Bellingcat reveals a sharp increase in the military’s air and drone strikes in Rakhine. After the AA resumed its offensive, strikes rose from 30 in 2023 to 461 in 2024. By the end of 2024, the AA had captured all but three townships in the state.
Bellingcat found that strikes were then concentrated in the townships where the junta is fighting to maintain control. They decreased in 13 townships captured by the AA and remained unchanged in one during 2025. By contrast, attacks increased in Kyaukpyu and Sittwe, yet to be captured by the AA. Data for Manaung is unavailable.
ACLED’s data comes from multiple sources, including news reports and social media. While the data is not exhaustive, a broad trend can be identified. You can read further details and caveats about the data here.
Su Mon Thant, Asia-Pacific analyst at ACLED,explained that the military conducts clearance operations to prevent the AA from using villages as buffers or shelters – a tactic employed across the country. “At the same time, it’s a warning sign for other villages,” she said, adding that when one village is set ablaze, it sends a signal to other villages not to “accept, shelter or harbor” armed groups. Thant also noted that people are displaced when their village is destroyed, eroding support for armed groups as locals suffer the consequences of the fighting.
The AA has vowed to take control of all of Rakhine by 2027 and success may bring a geopolitical shift in the region. The armed group’s control over Kyaukpyu and Sittwe will give it significant leverage, with both India and China having infrastructure projects in the townships, Steve Ross of the Stimson Center told Bellingcat.
But neither side can control the state without further alleviation of civilian suffering, Ross said. According to UNHRC data, there are almost half a million internally displaced people (IDPs) in Rakhine as of March 30, 2026.

In Sittwe township alone, about 120,000 Rohingya have been displaced by communal conflict since 2012.
“People displaced from other parts of Rakhine State during the war are in Sittwe, hundreds of thousands of civilians,” said Thant, adding that neither side can control the capital without significant loss of life.
There are also 1 million Rohingya refugees in Bangladesh. The futures of both the refugees and IDPs remain uncertain.
“Nobody can go home yet at this stage,” said Thant.
Bellingcat is a non-profit and the ability to carry out our work is dependent on the kind support of individual donors. If you would like to support our work, you can do so here. You can also subscribe to our Newsletter and follow us on Bluesky here, Instagram here, Reddit here and YouTube here.
The post The ‘Lost’ Villages of Myanmar’s Rakhine appeared first on bellingcat.
26.05.2026 à 19:01
Banned Russian Submunitions Found After Mali’s Military Announces Airstrikes
Sebastian Vandermeersch
This investigation is a collaboration between Bellingcat and Jeune Afrique. You can read Jeune Afrique’s article in French here. Unexploded Russian-made cluster munition bomblets, as well as damage consistent with bomblet impacts, have been found in a village in northern Mali – despite the West African country being a state party to the Convention on […]
The post Banned Russian Submunitions Found After Mali’s Military Announces Airstrikes appeared first on bellingcat.
Texte intégral (2376 mots)
This investigation is a collaboration between Bellingcat and Jeune Afrique. You can read Jeune Afrique’s article in French here.
Unexploded Russian-made cluster munition bomblets, as well as damage consistent with bomblet impacts, have been found in a village in northern Mali – despite the West African country being a state party to the Convention on Cluster Munitions (CCM) which prohibits their use.
The deployment of cluster munitions in northern Mali was first reported by Radio France International last week, citing local sources yet without showing images of the munitions or strikes in the reporting. However, social media footage posted on May 17, and since analysed by Bellingcat and our publishing partner, Jeune Afrique, shows unexploded Russian manufactured ShOAB-0.5 submunitions (bomblets).
Bellingcat geolocated a video showing the unexploded ShOAB-0.5 bomblets in the village of Tadjmart (18.977305, 0.86072), located approximately 55-kilometers (34-miles) south of the larger town of Aguelhok in northern Mali. This matches the location of airstrikes announced by the Malian Armed Forces (FAMa) on May 17. FAMa claimed it had identified armed groups in the area.

Russia’s paramilitary Africa Corps group, which is controlled by the Russian government and which replaced the Wagner mercenary group in the country, has been supporting Malian military operations.
Mali’s civil war has been ongoing since 2012. But the conflict has spiked in recent weeks as Tuareg separatists from the Azawad Liberation Front (FLA) and militants from the al-Qaeda affiliated Jama’at Nusrat al-Islam wal-Muslimin (JNIM) seized control of parts of the country in coordinated attacks against Malian and Africa Corps forces.
Les mercenaires continuent de larguer des bombes sur des maisons et certains diront pourquoi se révolter contre ces genres des pratiques inhumaines ne respectant aucun Droit. https://t.co/5jynKwUgeW pic.twitter.com/nB3ym4yooc
— Mohamed Lilly (@MedLilly1) May 17, 2026
The footage geolocated by Bellingcat shows the unexploded submunitions near buildings, alongside multiple small craters, consistent with submunition explosions.

The buildings and landmarks visible in the footage allowed us to geolocate where it was taken.

Additional footage geolocated by Bellingcat to nearby coordinates 18.97954, 0.85989 shows destroyed and burning buildings several hundred meters away, although this damage is not consistent with cluster munition use. The damage appears more significant than that which would be caused by submunition impacts.

Cluster munitions are explosive weapons which open mid-air to release large numbers of submunitions. They are prohibited from being used by signatories of the Convention on Cluster Munitions (CCM) because they are indiscriminate, saturate a wide area and can leave behind highly volatile unexploded bomblets which can kill civilians long after deployment.
Support Bellingcat
Your donations directly contribute to our ability to publish groundbreaking investigations and uncover wrongdoing around the world.
While Mali is a signatory to the CCM, Russia is not a state party to the agreement.
Brian Finucane, a senior adviser with the US Program at the International Crisis Group, told Bellingcat that as a party to the CCM, Mali is “subject to its prohibitions and requirements. These include not only prohibitions on the use of cluster munitions, but also obligations to clear and destroy such munitions on its territory.”
ShOAB-0.5 submunitions are carried by the Russian RBK-500 cluster munition dispenser. A single RBK-500 dispenser can deploy about 565 ShOAB-0.5 submunitions. There is as yet no footage posted online showing a spent dispenser linked to this incident.Footage did circulate online on May 16 showing the remnants of an RBK-500. It was claimed to have been used in a separate cluster munition strike in the Timbuktu region of Mali. However, this footage was not geolocatable, given it only shows a close up of the dispenser at night, nor was it possible to tell when the footage was taken.
A second video appears to show the same dispenser, but shows the side with visible Russian markings denoting the model: “РБК-500; ШОАБ-0.5; ТГ-30”. This identifies the dispenser, RBK-500, the submunition inside, ShOAB-0.5, and the explosive filler, TG-30.

RBK-500 dispensers are deployed by Russian-made aircraft including several MiG and Su models. According to the 2024 IISS Military Balance report, Mali does not have any known operational Russian fixed-wing attack aircraft. Two Russian Su-25 aircraft delivered to Mali – one in 2022 and another in 2023 – are reported to have crashed and been out of service since late 2023.
An Su-24M model has since appeared in satellite imagery captured at Modibo Keita International Airport in Bamako. The imagery was first published by France 24 in April 2025, although it was unclear if this aircraft was, or has been, operated by Africa Corps or Malian forces.
Bellingcat contacted the Malian military and Russian Ministry of Defence requesting comment, and asking which force was responsible for deploying cluster munitions. We did not receive a substantive response by publication time beyond the initial statement made by the FAMa which detailed it was responsible for the May 17 strike.
A video posted on May 17, by an account linked to Azawad rebels in Northern Mali, shows a person handling components of a ShOAB-0.5 submunition, seemingly unaware of the danger. However, as the video shows only a close up of the submunition, it has not been possible to geolocate the video or confirm when it was taken.
Les Azawadiens ne fabriquent pas les armes au contraire ils les démontent ! pic.twitter.com/0tqOb6ut9G
— Oumayya AG Ambeiry (@AgOumayya) May 17, 2026
The FLA condemned the use of cluster munitions in a statement published on May 18.
Bellingcat has previously reported on the use of cluster munitions in Syria and Ukraine and the danger they pose to civilians.
Youri van der Weide contributed to this report.
Bellingcat is a non-profit and the ability to carry out our work is dependent on the kind support of individual donors. If you would like to support our work, you can do so here. You can also subscribe to our Newsletter and follow us on Bluesky here, Instagram here, Reddit here and YouTube here.
The post Banned Russian Submunitions Found After Mali’s Military Announces Airstrikes appeared first on bellingcat.
14.05.2026 à 11:39
Satellite Imagery Shows Ongoing Demolitions Across Southern Lebanon
Jake Godin
The fragile ceasefire agreed between Israel and Hezbollah last month is holding. But satellite imagery shows that at least 46 of 54 towns and villages within the Israel Defense Forces (IDF) “Yellow Line” in southern Lebanon have been heavily damaged or, in some cases, entirely flattened. Much of the destruction and demolition has taken place […]
The post Satellite Imagery Shows Ongoing Demolitions Across Southern Lebanon appeared first on bellingcat.
Texte intégral (1452 mots)
The fragile ceasefire agreed between Israel and Hezbollah last month is holding.
But satellite imagery shows that at least 46 of 54 towns and villages within the Israel Defense Forces (IDF) “Yellow Line” in southern Lebanon have been heavily damaged or, in some cases, entirely flattened.
Much of the destruction and demolition has taken place in recent weeks.
Bellingcat’s satellite imagery analysis examined towns and villages identified on OpenStreetMap, a community-driven map database. Medium resolution PlanetScope satellite imagery covering each of the locations was provided by Planet Labs, a US company that recently restricted some of its imagery in the Middle East.
Bellingcat is sharing the annotated PlanetScope imagery for the dates of March 2 and May 8, 2026, showing the scale of damage that has occurred during roughly the first two months of the US-Israeli war against Iran.
The towns and villages detailed in the map are colour coded. Red shows locations that have suffered varying degrees of damage or destruction, while yellow shows locations that were damaged prior to the US-Israeli war with Iran. White shows locations that have not been significantly damaged at time of publication.
Scroll and zoom to see damage throughout southern Lebanon in each of the date tabs. The first image is from March 2, 2026, shortly after the US and Israel attacked Iran. The second image is from May 8, 2026, more than two months after the start of the war and amid a fragile ceasefire between Israel and Hezbollah. PlanetScope imagery via Planet Labs PBC.
Israel’s Defence Minister, Israel Katz, is reported to have stated that “all homes in Lebanese villages near the border will be destroyed — in accordance with the Rafah and Beit Hanoun model in Gaza”. The aim, Katz said, is to “remove, once and for all, the threats near the border”. Israel has adopted similar methods of flattening buildings and homes close to Israel’s border in Gaza.
The large-scale destruction in southern Lebanon has been reported by multiple outlets including the BBC, CNN, SkyNews and The New York Times. These reports have shared images from several towns and villages, but Bellingcat is publishing satellite imagery for the entirety of southern Lebanon. The changes between the two dates show the scale and pace of destruction.
Take our survey
Help shape the future of our collective.
Within the Yellow Line — the area occupied by the IDF since a ceasefire was agreed between Hezbollah and Israel on April 16 — some towns were reported already destroyed or heavily damaged during the 2024 Israeli invasion of southern Lebanon. Some — like the coastal border town of Naqoura or the southeastern border town of Kfar Kila — have now been largely demolished. This is visible in both the medium-resolution PlanetScope imagery, and in high-resolution imagery obtained from Airbus by the BBC.
Everything south of Lebanon’s Litani and Zahrani Rivers has been under evacuation orders issued by the IDF since early March, with regular updates warning residents to leave ahead of airstrikes.
Much of the destruction within the “Yellow Line” appears to be from either controlled demolitions using explosives or construction vehicles. The IDF has shared numerous videos showing large-scale demolitions conducted in the towns and villages in southern Lebanon, while videos shared elsewhere on social media show the aftermath — large parts of towns like Beit Lif or Kheim reduced to rubble.
One particularly large explosion took place in the small village of Qantara, where the IDF says it found two large tunnel systems built by Hezbollah.
The tunnels were detonated with 450 tonnes of explosives, leaving large parts of the village obliterated. Another video released by the IDF showed some of the few remaining buildings in the nearby village of Aadashit being demolished with explosives. The IDF claimed the buildings were “Hezbollah infrastructure”.


Before and after imagery from Planet Labs shows the villages of Qantara and Aadshit in southern Lebanon on March 2 and April 30, 2026. The April imagery shows the aftermath of two large demolitions conducted by the IDF. Large parts of both villages have also been demolished. The UNP 7-1 label details the position of a UN peacekeepers facility.
Bellingcat contacted the IDF for comment on the details in this story but did not receive a response before publication.
A full size version of the map can be found here.
Bellingcat is a non-profit and the ability to carry out our work is dependent on the kind support of individual donors. If you would like to support our work, you can do so here. You can also subscribe to our Newsletter and follow us on Bluesky here, Instagram here, Reddit here and YouTube here.
The post Satellite Imagery Shows Ongoing Demolitions Across Southern Lebanon appeared first on bellingcat.
- GÉNÉRALISTES
- Le Canard Enchaîné
- La Croix
- Le Figaro
- France 24
- France-Culture
- FTVI
- HuffPost
- L'Humanité
- LCP / Senat
- Le Media
- La Tribune
- Time France
- EUROPE ‧ RUSSIE
- Courrier Europe Ctrale
- Desk-Russie
- Euractiv
- Euronews
- Toute l'Europe
- Afrique ‧ Asie ‧ Proche-Orient
- Haaretz
- Info Asie
- Inkyfada
- Jeune Afrique
- Kurdistan au féminin
- L'Orient - Le Jour
- Orient XXI
- Rojava I.C
- INTERNATIONAL
- Courrier International
- Equaltimes
- Global Voices
- Infomigrants
- I.R.I.S
- The New-York Times
- OSINT ‧ INVESTIGATION
- OFF Investigation
- OpenFacto°
- Bellingcat
- Disclose
- G.I.J
- I.C.I.J
- OPINION
- Au Poste
- Cause Commune
- CrimethInc.
- Hors-Serie
- L'Insoumission
- Là-bas si j'y suis
- Les Jours
- LVSL
- Politis
- Quartier Général
- Rapports de force
- Reflets
- Reseau Bastille
- StreetPress
- OBSERVATOIRES
- Armements
- Acrimed
- Conspirationnisme
- Culture
- Curation IA
- Extrême-droite
- Human Rights Watch
- Inégalités
- Justice fiscale
- Liberté de création
- Multinationales
- Situationnisme
- Sondages
- Street-Médics
- Routes de la Soie
- Wokisme